Advances in Animal and Veterinary Sciences
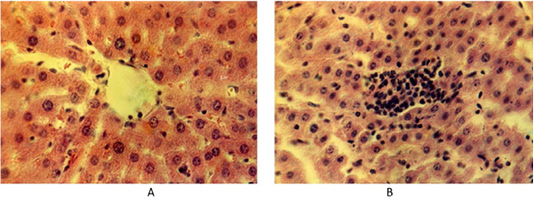
(A) Liver of the control group of animals. Hematoxylin and eosin. Image scale 400:1. (B) Accumulation of lymphoid tissue inside the liver lobules at fasciolosis in the second group of weakly infected animals. Hematoxylin and eosin. Image scale 400:1.
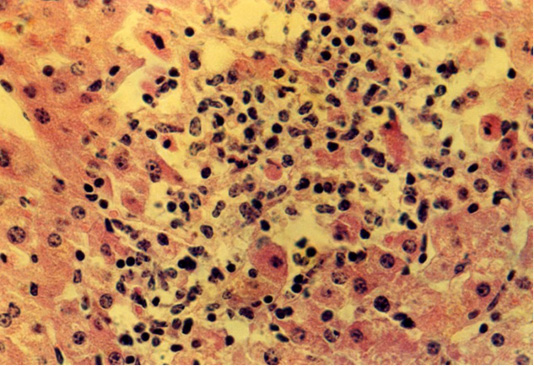
Isolated location of hepatocytes amid lymphocytes and macrophages at fasciolosis of the second group animals. Hematoxylin and eosin. Image scale 400:1.
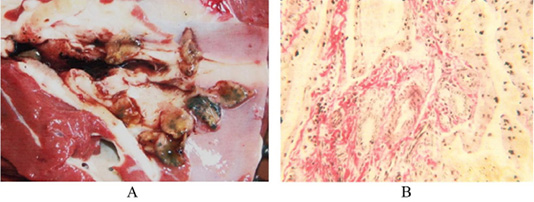
(A) Liver of the third cattle group. Bile ducts with thickened walls and live fascioles, Original. (B) Liver of the third cattle group. An enlarged stroma with dilated capillaries filled with blood. Van Gieson. Image scale 400:1
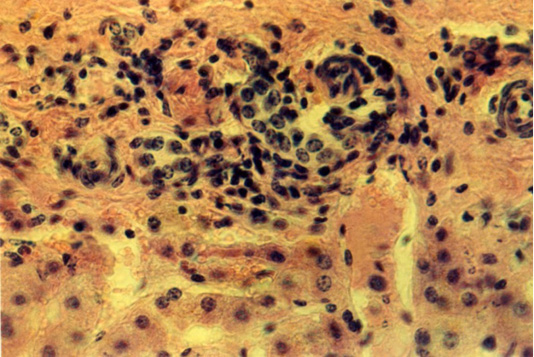
Liver of the third animals group. The lymphoid cells around the triads of the liver. Hematoxylin and eosin. Image scale 400:1.


