Advances in Animal and Veterinary Sciences
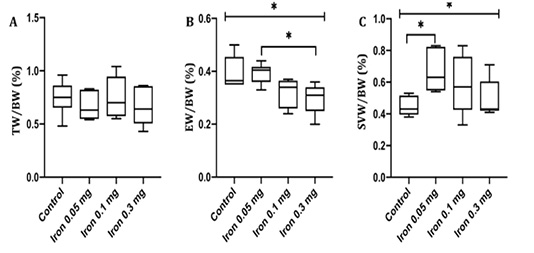
Testis weight-body weight ratio (A) epididymis weight-body weight ratio (B) and seminal vesicles weight-body weight ratio (C) in control and treatment group measured after 18 days of iron dextran. TW= Testis weight; BW= Body weight; EW= Epididymis weight; SVW= Seminal vesicles weight; *= p<0.05
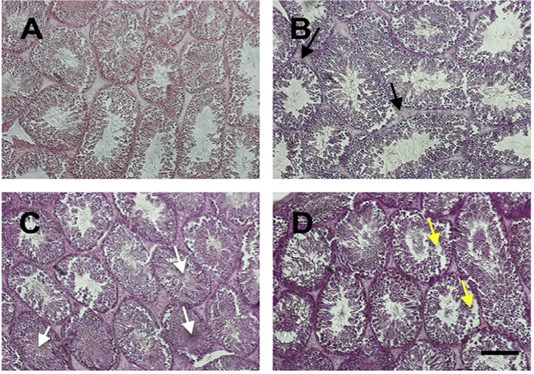
The histology of testis stained by HE staining in control (A) and treatment groups (B-D; Iron dextran 0.05, 0.1 and 0.3 mg/day respectively). Treatment groups showed interstitial cell hyperplasia (black arrow), fibrin coalescent in the center of tubules (white arrow) and some of the spermatogonium and spermatocyte cells were detached from the basalis membrane (yellow arrow). Scale bar=100 μm.
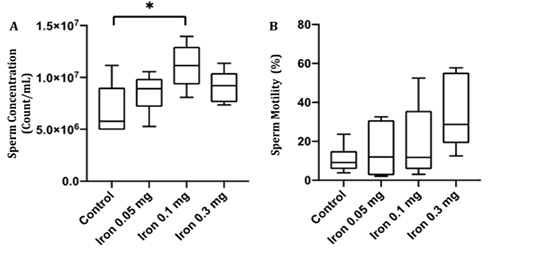
The epididymal sperm concentration (A) and motility (B) in the control and treatment group after 18 days of iron dextran injection.*=p<0.05.
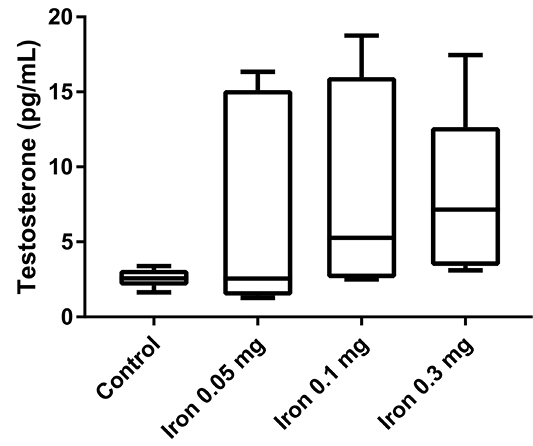
Testosterone serum level in control and treatment groups after 18 days


