Advances in Animal and Veterinary Sciences
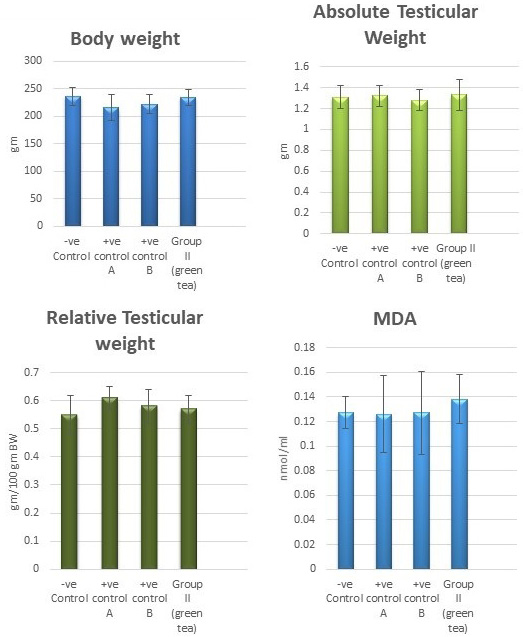
Bar charts showing the comparative magnitude of mean values of the body weight, testicular weight, relative testicular weight and MDA among the negative control group, positive control A (Corn oil group), positive control B (Distilled water group) and Green tea group (II).
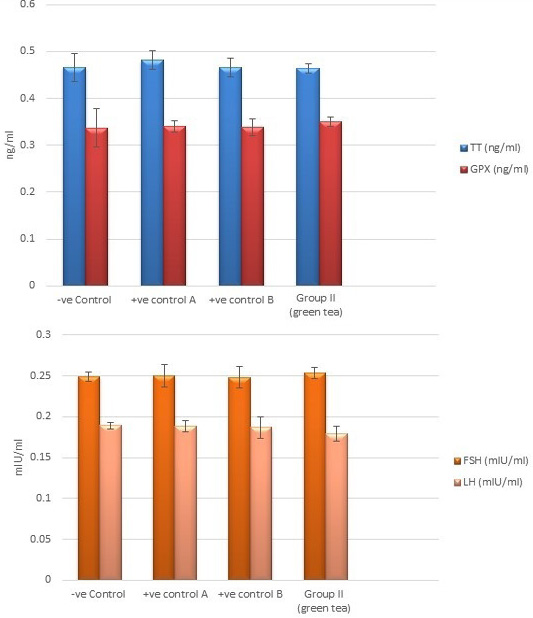
Bar charts showing the comparative magnitude of mean values of testosterone, GPX, FSH, and LH levels among the negative control group, positive control A (Corn oil group), positive control B (Distilled water group) and Green tea group (II).
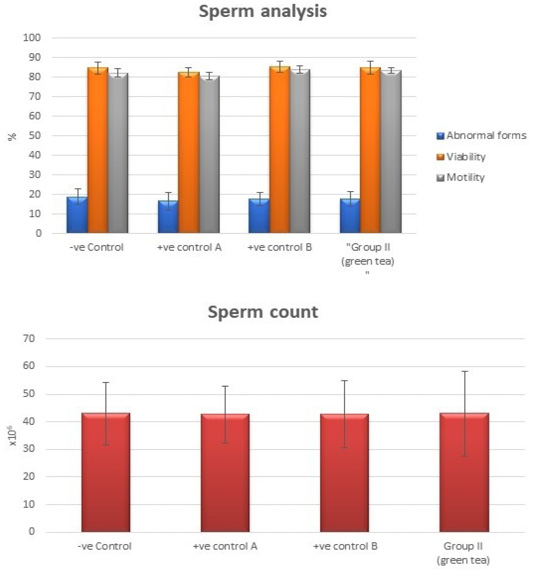
Bar charts showing the comparative magnitude of mean values of sperm count, abnormal forms, sperm motility, and sperm viability among negative control group, positive control A (Corn oil group), positive control B (Distilled water group) and Green tea group (II).
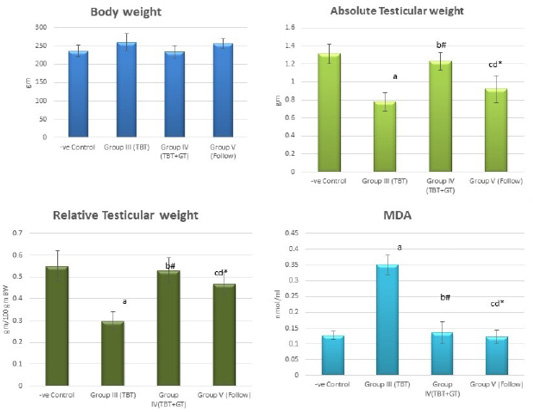
Bar charts showing the comparative magnitude of mean values of the body weight, absolute testicular weight, relative testicular weight and MDA among the negative control group (I), TBT treated group (III), TBT and green tea group (IV) and follow up group (V).
#p>0.05, *p<0.05, ap<0.001 compared to control group, bp<0.001, cp<0.05 compared to TBT group, dp<0.05 compared to TBT +GT group. Values are presented as mean ± SD (n= 6 in each group).
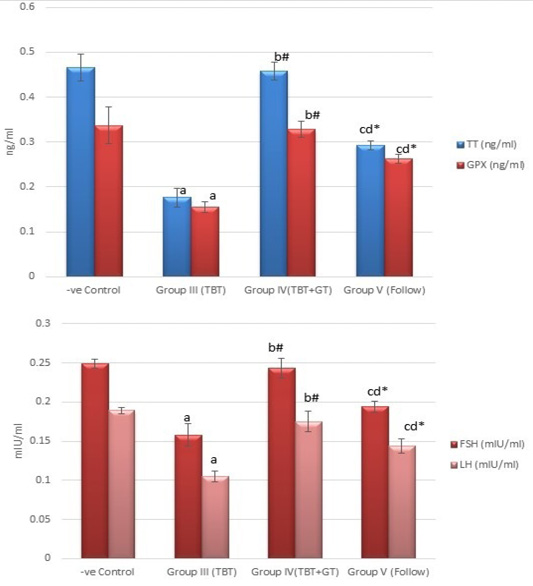
Bar charts showing the comparative magnitude of mean values of testosterone, GPX, FSH, and LH levels among the negative control group (I), TBT treated group (III), TBT and green tea group (IV) and follow up group (V).
#p>0.05, *p<0.05, ap<0.001 compared to control group, bp<0.001, cp<0.05 compared to TBT group, dp<0.05 compared to TBT +GT group. Values are presented as mean ± SD (n= 6 in each group).
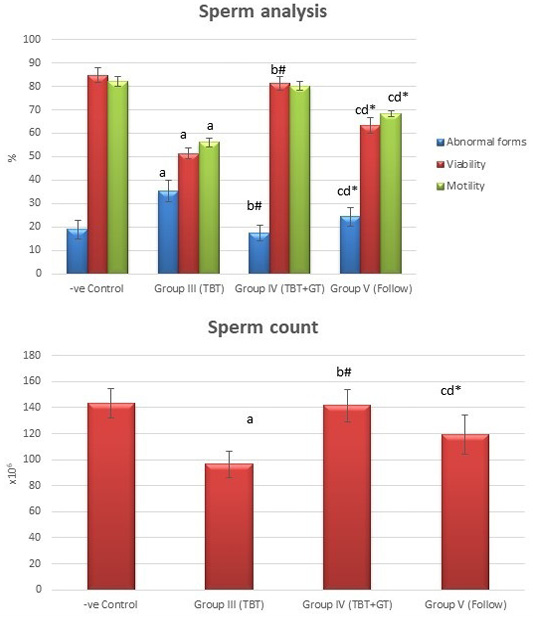
Bar charts showing the comparative magnitude of mean values of sperm count, abnormal forms, sperm motility, and sperm viability among the negative control group (I), TBT treated group (III), TBT and green tea group (IV) and follow up group (V).
#p>0.05, *p<0.05, ap<0.001 compared to control group, bp<0.001, cp<0.05 compared to TBT group, dp<0.05 compared to TBT +GT group. Values are presented as mean ± SD (n= 6 in each group).
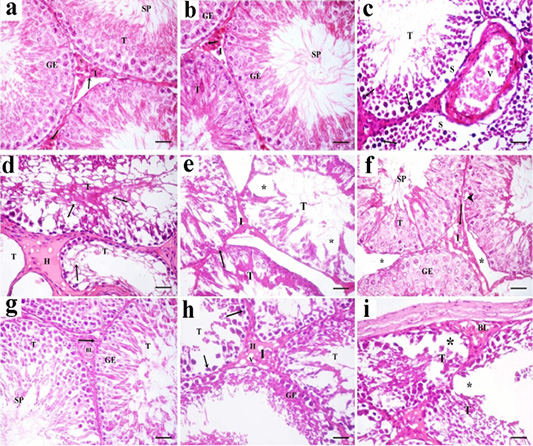
A photomicrograph of H and E stained sections of the control subgroups showing similar histological results, so the negative control group is considered as the control group. a: H and E stained sections of the control testes reveals numerous packed seminiferous tubules (T) that are lined by stratified germinal epithelium (GE). Spermatozoa (SP) are present in the lumen of seminiferous tubules. Interstitium (I) contains interstitial cells (arrow) and blood vessels (v). b: Examination of Hand E stained sections in rat testes of green tea group revealed also normal histological structure. Packed seminiferous tubules (T) that are lined by stratified germinal epithelium (GE). Spermatozoa (SP) are present in the lumen of seminiferous tubules. Interstitium (I) containing Leydig cells (arrow) is also seen; c: Sections in TBT treated group reveal marked disorganized seminiferous tubules (T). Some sections showing tubules with their germinal epithelium separated from their basal laminae (S). Germinal epithelial cells with dark pyknotic nuclei (arrow) are detected. Blood vessels (V) in the interstitium are dilated and congested; d: Other sections in TBT treated group showing seminiferous tubules (T) with a marked decrease in the epithelial height or lose their lining epithelium, other tubules had marked vacuolations (v). Acidophilic vacuolated hyaline material (H) is present in the interstitium in between the tubules; e: Sections in TBT treated group reveals shrinkage of the tubules (T) with irregular basement membrane (arrow), wide Interstitium (I), and areas of tissue loss in the lining germinal epithelium (*). f: Examination of sections in the TBT and green tea group showing improvement in the histological picture of the germinal epithelium (GE) of seminiferous tubules (T). Some spermatozoa (SP) are present in the lumen of the tubules. Separation between some tubules (*) and intracellular vacuolations (arrowhead) in some germinal epithelial cells are still detected; g: Other sections in TBT and green tea group showing normal histological structure. Tubules (T) are lined by germinal epithelium (GE). Spermatozoa (SP) are present in the lumen of the tubules. Interstitium (I) containing Leydig cells (arrow) and blood vessels (BL) is also detected; h: Sections in the follow-up group showing tubules (T) lined by germinal epithelial cells (GE), most of them had dark pyknotic nuclei (arrow). Interstitium (I) reveals hyaline (H) vacuolated material (V); i: Other sections in the follow-up group showing, disorganized tubules (T), congested blood vessels (BL), and marked cellular loss (*). H and E× 400 (scale bar 20µm).
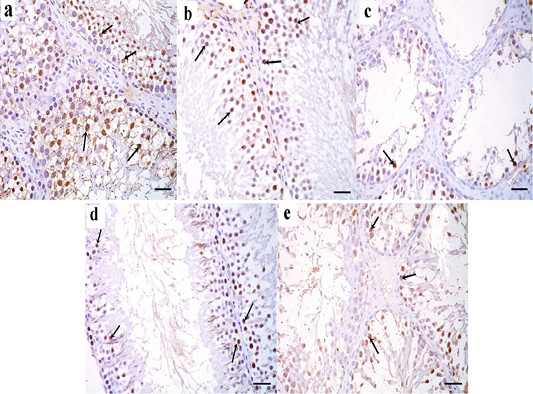
a: Immunohistochemical reaction for ki67 stained sections in the testicular tissue of the control group showing a strong positive reaction in the nuclei of germinal epithelial cells (arrow); b: Immunoperoxidase technique for ki67 in green tea treated group showing a strong positive reaction in the nuclei of germinal epithelial cells (arrow); c: In TBT treated group, a positive reaction for ki67 in the nuclei of few germinal epithelial cells is seen (arrow); d: TBT and green tea treated group reveals strong positive reaction in the nuclei of most of the germinal epithelial cells (arrow); e: In the follow-up group, a strong positive reaction is seen in the nuclei of some germinal epithelial cells (arrow). Immunoperoxidase technique× 400 (scale bar 20µm).
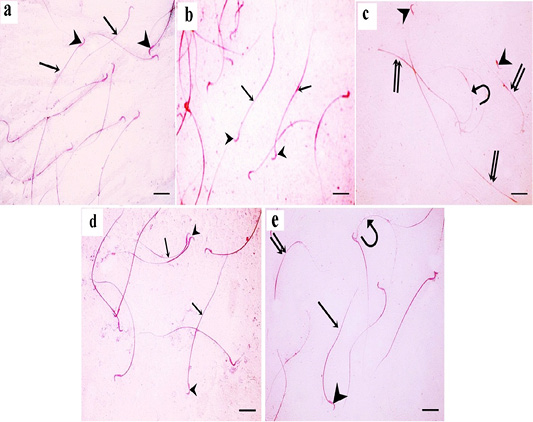
a: A photomicrograph of sperms from the control rats showing normal morphology with normal heads (arrowheads) and normal tails (arrows); b: In green tea treated group, normal sperm morphology is detected. Sperms have smooth heads with hooked tapering apex (arrowhead) and normal long tails (arrow); c: In TBT treated group, sperm abnormalities are detected in the heads and tails; curved sperms (curved arrow), headless tails (double arrow), and abnormally shaped heads (arrowhead) are seen; d: In TBT and green tea treated group, marked improvement in sperm morphology as the sperms are with normal heads (arrowhead) and tails (arrow). e: In the follow-up group, some sperms are with normal heads (arrowhead) and tails (arrow), however, others still have abnormalities such as headless tails (double arrow) and curved sperms (curved arrow). Eosin-nigrosin X 400 (scale bar 20µm).
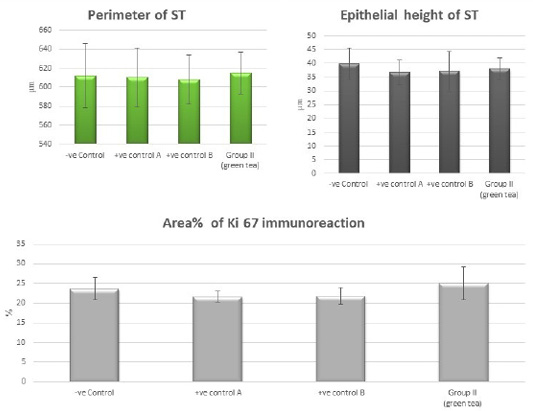
Bar charts showing the comparative magnitude of mean values of the perimeter of ST, the epithelial height of ST and area% of Ki 67 immunoreaction among the negative control group, positive control A (Corn oil group), positive control B (Distilled water group) and Green tea group (II).
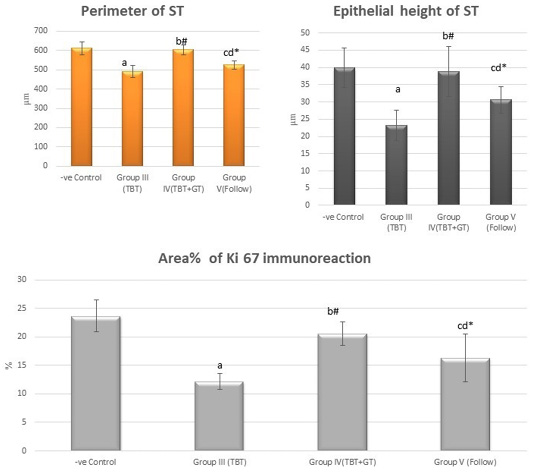
Bar charts showing the comparative magnitude of mean values of the perimeter of ST, the epithelial height of ST and area% of Ki 67 immunoreaction among the negative control group (I), TBT treated group (III), TBT and green tea group (IV) and follow up group (V).
#p>0.05, *p<0.05, ap<0.001 compared to control group, bp<0.001, cp<0.05 compared to TBT group, dp<0.05 compared to TBT +GT group. Values are presented as mean ± SD (n= 6 in each group).


