Advances in Animal and Veterinary Sciences
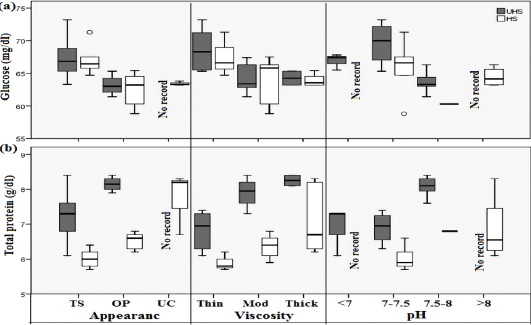
Boxplot analysis of cervical mucus distribution of glucose (a) and total protein (b) as affected by UHS and HS of Egyptian Baladi cow. The plots show the median (line within box), 25th and 75th percentiles (box), 10th and 90th percentiles (whiskers), and outliers (circles).
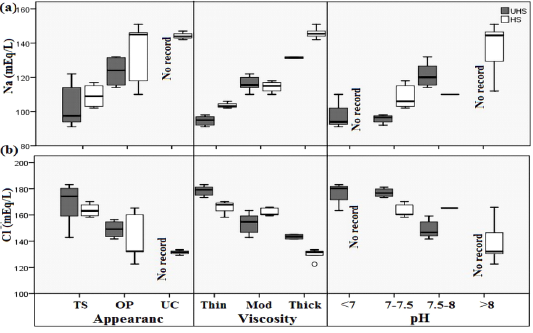
Boxplot analysis of cervical mucus distribution of Na (a) and CL (b) as affected by UHS and HS of Egyptian Baladi cow. The plots show the median (line within box), 25th and 75th percentiles (box), 10th and 90th percentiles (whiskers), and outliers (circles).
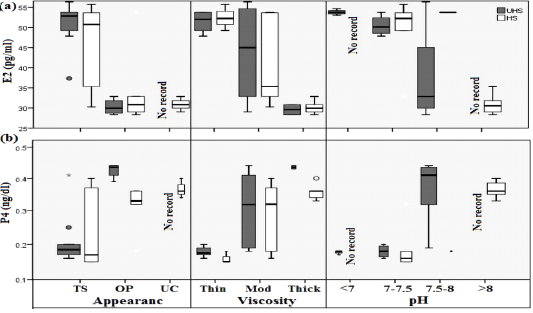
Boxplot analysis of cervical mucus distribution of E2 (a) and P4 (b) as affected by UHS and HS of Egyptian Baladi cow. The plots show the median (line within box), 25th and 75th percentiles (box), 10th and 90th percentiles (whiskers), and outliers (circles).


