Advances in Animal and Veterinary Sciences
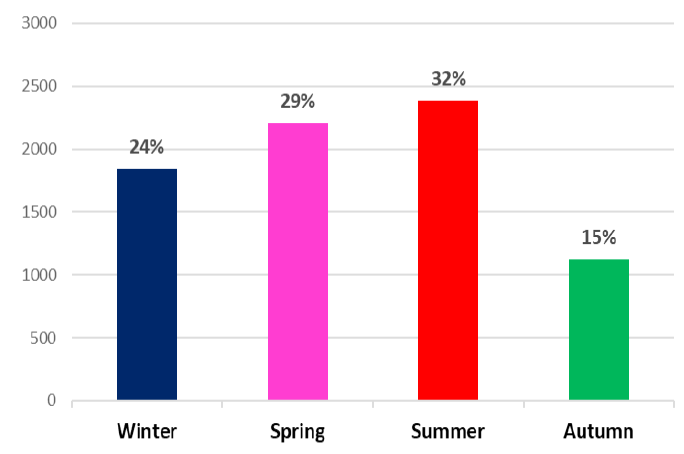
Frequency percentage of liver condemnation and losses during four seasons.
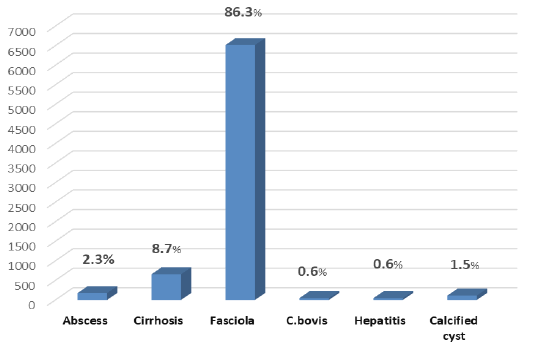
Prevalence % of different causes of liver condemnation along four seasons (1 year).
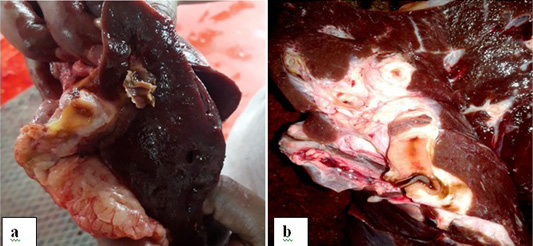
Gross appearance of cross sectioned condemned liver with fascioliasis showing. (a) Fasciola parasite in the bile duct which appeared enlarged, thickened, and fibrosed; (b)Whitish foci on the surface of the liver with size varied from 0.5 to 1.5 cm in diameter.
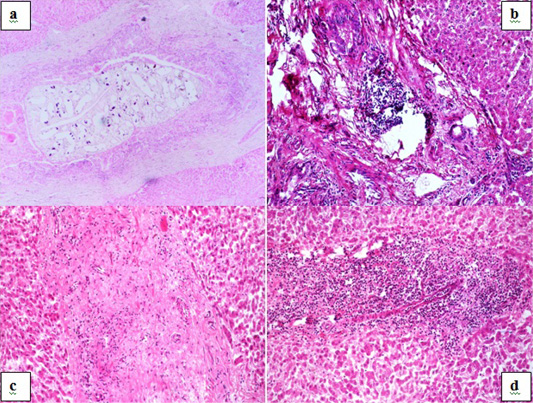
Photomicrograph of condemned Liver (H and E X 200) showing. (a) Fascioliasis; note the Fasciola parasite in the hyperplastic thickened wall bile duct; (b) Biliary cirrhosis; note the hyperplastic bile duct, newly formed bile ductules, fibrous connective tissue proliferations, and mononuclear cells infiltrations; (c) Lobular Cirrhosis; note the diffuse fibrous connective tissue proliferation among the hepatic lobule and infiltrated with mononuclear cells; (d) Massive liver degeneration and necrosis with atrophied hepatocytes and multifocal areas of mononuclear cells infiltration.


