Advances in Animal and Veterinary Sciences
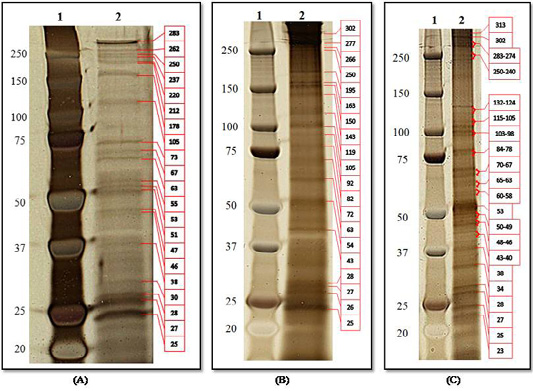
Protein analysis of O. felineus antigens by SDS-PAGE and visualization by Silver Quest Staining Kit: (A) ES-Ag; (B) S-Ag; (C) E-Ag. Line 1, molecular markers; line 2, electropherogram of antigens.
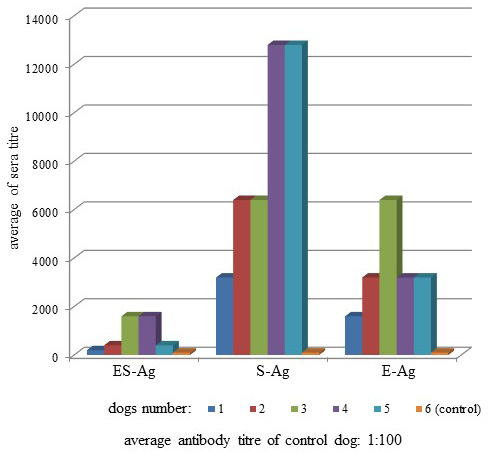
Antigenicity of O. felineus antigens in indirect-ELISA.
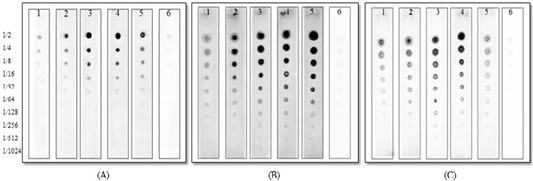
Dot immunoblot patterns of O. felineus antigens in sera of infected and control dogs: (A) ES-Ag; (B) S-Ag; (C) E-Ag. Line 1, 2, 3, 4, 5, sera of infected dogs; line 6, sera of the control dog. The numbers on the left indicate to antigen dilutions that reacted with serum.
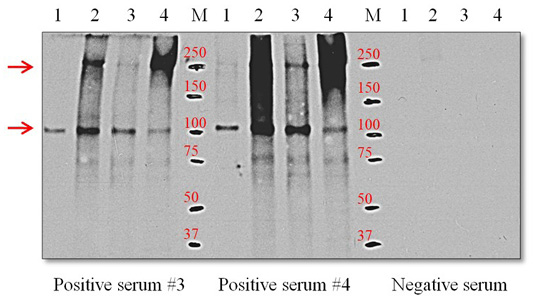
Western blot using positive serum with O. felineus antigens. Line 1, ES-Ag; line 2, S-Ag fraction 1; line 3, S-Ag fraction 2; line 4, E-Ag; M, molecular markers. Molecular mass markers are expressed in kDa. The arrows on the left indicate proteins with molecular masses of 105 and 205 kDa that react with positive serum.


