Advances in Animal and Veterinary Sciences
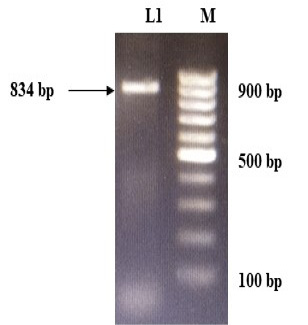
Amplification of gD gene of BoHV-1.
L1: gD PCR product of 834bp; M: 100 bp DNA Ladder.
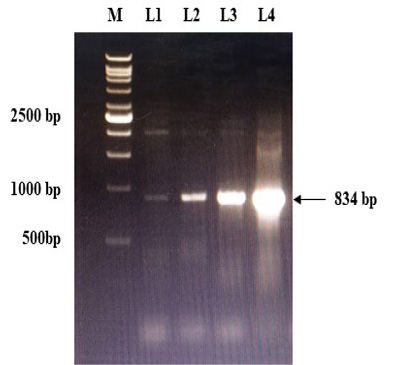
Confirmation of recombinant plasmids (gD) by PCR. L1 to L4: Positive recombinant plasmids showing PCR product of 834 bp; M: VC1Kb DNA Ladder.
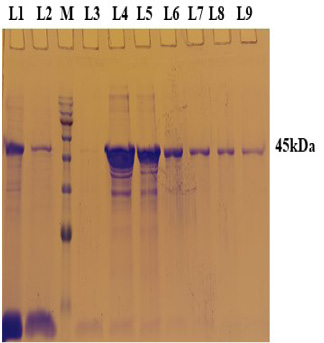
A 12% SDS-PAGE of purified rgD protine eluted in different fraction using Ni-NTA affinity chromatography column.
L1: Sample flow through; L2: Eluate with wash buffer; M: Magspin-29 protein ladder, 10-180kDa; L3 to L9: Different fraction of eluates.
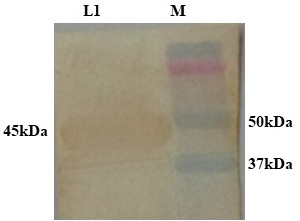
Confirmation of dialysed rgD protein by western blot using Ni-HRP Probe. L1: Dialysed rgD protein (45kDa); M: Protein Ladder 10-250kDa.
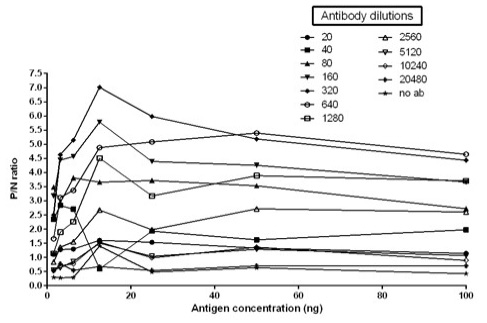
Graph illustrating optimal antigen concentration and antibody dilution used for calculation of cut off value. Optimal antigen concentration: 12.5ng; Optimal antibody dilution: 1:320
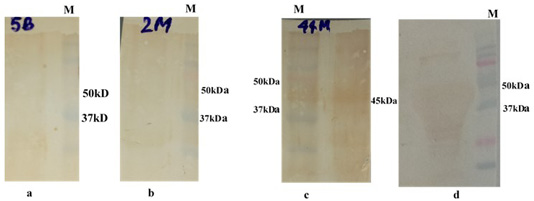
Western bolt analysis of expressed rgD protein with bovine field sera: a and b: negative field serum; c and d: Positive field serum giving band of rgD (45 kDa); M: Protein Laddwr 10-250kDa.
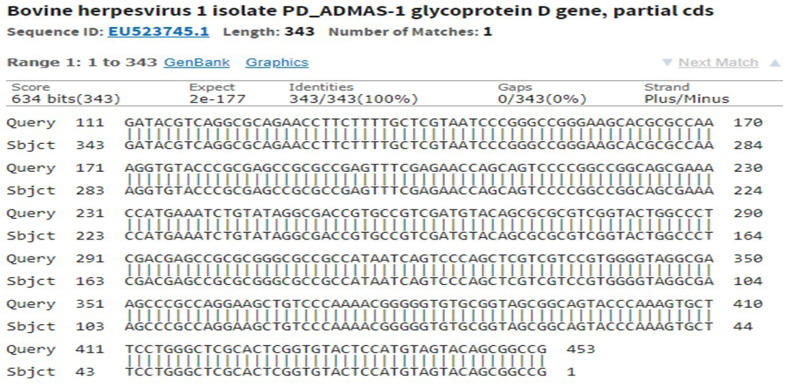
Sequencing of recombinant gD gave 100% identity with partial cds of BoHV-1 in NCBI database accession number: EU523745.1
Sequencing of recombinant gD gave 99% identity with complete genome of BoHV-1 in NCBI database accession number: AJ004801.1
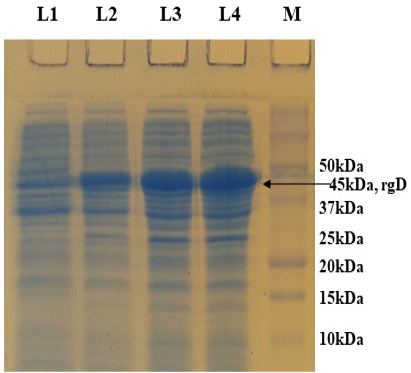
12% SDS-PAGE showing rgD protein expressed at 32 oC induced with 0.15% Rhamnose, collected at different time intervals. L1: Uninduced; L2: 4 hr post induction; L3: 6 hr post induction; L4: 8 hr post induction; M: Protein Ladder (Precision Plus, BIO-RAD).


