Advances in Animal and Veterinary Sciences
Research Article
Adv. Anim. Vet. Sci. 8(8): 800-803
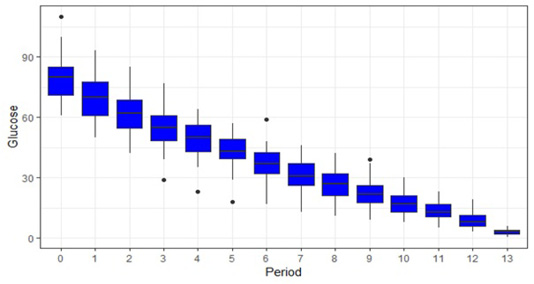
Figure 1
Box plot showing glucose value (mg/dl in Y axis) at different time period(X-axis). Here 13 and 0 on X-axis indicate the mean glucose value of all the samples at 24 hour and baseline glucose value respectively. Mean glucose value at 1 hour is significantly lower (p<0.005) than baseline value and glucose value at 2 hours is significantly lower than value 1 hour.


