Advances in Animal and Veterinary Sciences
Short Communication

Multivariate Adaptive Regression Splines Data Mining Algorithm for Prediction of Body Weight of Hy-Line Silver Brown Commercial Layer Chicken Breed
Thobela Louis Tyasi*, Kgotlelelo Maaposo Makgowo, Kwena Mokoena, Lebo Trudy Rashijane, Madumetja Cyril Mathapo, Lebogang William Danguru, Kagisho Madikadike Molabe, Paul Mogowe Bopape, Nhlakanipho Divine Mathye, Dannis Maluleke
School of Agricultural and Environmental Sciences, Department of Agricultural Economics and Animal Production, University of Limpopo, Private Bag X1106, Sovenga 0727, Limpopo, South Africa.
Abstract | Multivariate Adaptive Regression Splines (MARS) data mining algorithm is a non-parametric regression method employed to obtain the prediction of live weight by using body measurements. The study was conducted to investigate the relationship between body weight, linear body measurement traits and the effect of linear body measurement traits on body weight of Hy-Line silver brown commercial layer. A total of one hundred (n= 100) Hy-Line silver brown commercial layers aged 22 weeks were used for body measurements viz; body weight (BW) in kilograms, Beak Length (BK), Body Length (BL), Body Girth (BG), Shank Length (SL) and Wing Length (WL) in centimetres. Furthermore, Pearson correlation and MARS methods were used for data analysis. Correlation results revealed that BW had a negative statistically high significant correlation with WL (r= -0.48**) and BL (r= -0.61**). MARS results developed a non-parametric regression model with coefficient of determination (R2) = 1, adjusted coefficient of determination (R2 adj.)= 1, standard deviation ration (SD ratio) = 0.006, root mean square error (RMSE) = 0.001 and Pearson correlation (r) = 1 between predicted and actual values (P < 0.01) of body weight. MARS model revealed that WL and BL had an effect on BW of Hy-Line silver brown commercial layer. The findings suggest that WL and BL had an effect on BW, therefore chicken layer farmers might use WL and BL for selection during breeding to improve BW. In conclusion, MARS models developed in this study might be used by chicken layer farmers for selection during breeding.
Keywords | Body weight, Correlation, Data mining algorithm, Layer, Wing length
Received | April 29, 2020; Accepted | June 21, 2020; Published | July 07, 2020
*Correspondence | Thobela Louis Tyasi, School of Agricultural and Environmental Sciences, Department of Agricultural Economics and Animal Production, University of Limpopo, Private Bag X1106, Sovenga 0727, Limpopo, South Africa; Email: louis.tyasi@ul.ac.za
Citation | Tyasi TL, Makgowo KM, Mokoena K, Rashijane LT, Mathapo MC, Danguru LW, Molabe KM, Bopape PM, Mathye ND, Maluleke D (2020). Multivariate adaptive regression splines data mining algorithm for prediction of body weight of Hy-line silver brown commercial layer chicken breed. Adv. Anim. Vet. Sci. 8(8): 794-799.
DOI | http://dx.doi.org/10.17582/journal.aavs/2020/8.8.794.799
ISSN (Online) | 2307-8316; ISSN (Print) | 2309-3331
Copyright © 2020 Tyasi et al. This is an open access article distributed under the Creative Commons Attribution License, which permits unrestricted use, distribution, and reproduction in any medium, provided the original work is properly cited.
INTRODUCTION
Hy-Line silver brown commercial layer is an exotic chicken breed which is recognised as one of the most productive egg layers, producing over 330 rich brown eggs up to seventy-four weeks (Okoro et al., 2017). This breed is characterised as excellent liveability, superior egg production, great egg quality, good body weight at the end of laying period and docile temperament (Okoro, 2003). Multivariate Adaptive Regression Splines (MARS) data mining algorithm is a data mining algorithm which is a form of regression analysis developed by Friedman (1991). This data mining algorithm is a non-parametric regression procedure which can produce linear models that are nonlinearities and interactions between predictor variables (Nieto et al., 2015). MARS have been conducted in several studies to predict body weight using linear body measurement traits of Mengali rams (Eyduran et al., 2017; Celik et al., 2018), Turkish Tazi dogs (Celik, 2019), Pakistan goats (Celik and Yilmaz, 2017). Ige et al. (2016) indicated that MARS data mining algorithm is the best method for developing better breeding strategies in animals. Estimation of live body weight using linear body measurement traits in animals results in multi-collinearity problems (Tyasi et al., 2018) then again MARS data mining algorithm overcomes the multi-collinearity problems in the prediction of body weight (Celik and Yilmaz, 2017). Therefore, based on acquired knowledge, there is limited documentation on predicting the effect of linear body measurement traits on the body weight of chickens using Multivariate Adaptive Regression Splines data mining algorithm.
Hence, the objectives of the study were 1) to determine the relationship between Body Weight (BW) and linear body measurement traits viz; Beak Length (BK), Body Length (BL), Body Girth (BG), Shank Length (SL) and Wing Length (WL) of Hy-Line silver brown commercial layer using correlation analysis, 2) to determine the effect of linear body measurement traits on the body weight of Hy-Line silver brown commercial layer using MARS. This study will help Hy-Line silver brown commercial layer farmers during breeding to improve body weight by selection using linear body measurement traits.
MATERIALS AND METHODS
Experimental animals and management
One hundred (n = 100) of Hy-Line silver brown commercial layer at the age of 22 weeks were used for data collection at the University of Limpopo Experimental farm, South Africa. All chickens were randomly selected for data collection in the study, where the measurements were collected once per birds. Water and feed were given to the chickens without restriction. Hy-Line silver brown commercial layer were fed with a diet that contained fish meal (5%), soya Hipro (4.37%), maize (64%), full fat soya (4.91%), maize gluten meal (11.67%), Di sodium phosphate (1.33%), L-lysine (0.20%), CaCO3 (8.17), DL-methionine (0.20%) and vitamin trace element premix (0.15%). Body Weight (BW), Beak Length (BK), Body Length (BL), Body Girth (BG), Shank Length (SL) and Wing Length (WL) were collected as shown in Figure 1.
All the data collection procedures were conducted as described by Ige et al. (2016) and Tyasi et al. (2018). Linear body measurement traits were collected as follows: BK was measured as the length of the beak; BL was measured as the distance between the base of the neck and the cloaca; BG was taken when a measuring tape is looped around the region of the breast under the wing; SL was recorded as the length of tarso-metatarsus from the hock joint to the metatarsal pad and WL was measured as the length from the humorous-coracoid junction to the distal tip of the phalange digits. All the measurement procedures were conducted by the same person to avoid individual differences on accuracy.
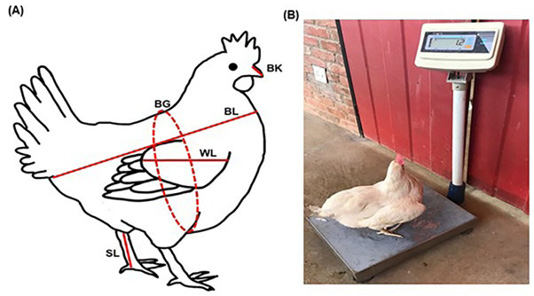
Figure 1: Body measurements of Hy-Line silver brown commercial layer. (A). Anatomical structure showing linear body measurement traits taken in centimetres (cm), (B). Chicken showing body weight taken in kilograms (kg). BW, Body weight; WL, Wing Length; BK, Beak length; SL, Shank Length; BG, Body girth; BL, Body length.
Statistical analysis
Statistical Package for Social Sciences, IBM SPSS (2015) software was used to compute the descriptive statistics. R-software was employed to determine the relationship between body weight and linear body measurement traits and constructing heat map of correlation coefficients. Multivariate adaptive regression splines data mining algorithm was conducted as described by Celik and Yilmaz (2017). Briefly; MARS algorithm was used as follows:
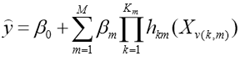
Where;
y= predicted value of body weight, β0= constant, hkm (X v (k, m)) = basis function, in which v (k, m) = index of the predictor used in the mth component of the kth product, Km = parameter limiting the order of interaction. Generalized Cross-Validation error (GCV) was employed to remove basis functions do not contribute to the quality of model by the pruning process. The following GCV model was used as described by Celik and Yilmaz (2017):
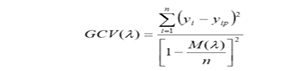
Where;
n = number of training cases, Yi = actual value of body weight, Yip = predicted value of linear body measurement traits (BK, BL, BG, SL, WL), M (λ) = penalty function for the complexity of the model containing λ terms. In the current study, coefficient of determination (R2), adjusted coefficient of determination (R2 adj.), standard deviation ratio (SD ratio) and root mean square error (RMSE) were estimated using the following equations as discussed by Celik and Yilmaz (2017):
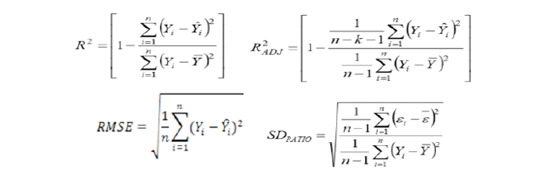
The best MARS model was selected based on the highest R2, r and R2 adj. including the smallest GCV, SD ratio and RMSE. All the Multivariate Adaptive Regression Splines data mining algorithm calculations were executed through the package ‘earth’ of R Studio software.
RESULTS AND DISCUSSION
Descriptive statistics of measured traits
In the current study, the descriptive statistics were analysed to establish the summary of the data. Table 1 shows the summary of body weight and linear body measurement traits viz; body length, body girth, shank length, wing length and back length. Summary data showed that the body weight of Hy-Line silver brown commercial layer ranged from 1.10 to 2.00 kg while the results were noted as 16.57 ± 0.58 cm for wing length, 2.85 ± 0.04 cm for beak length, 9.07 ± 0.06 cm for shank length, 38.89 ± 0.43 cm for body girth and 37.29 ± 0.18 cm for body length, respectively. The descriptive statistics were higher than those of Tyasi et al. (2017) in Chinese indigenous Dagu chicken layer breed and Tyasi et al. (2018) in Chinese indigenous male chicken breed, but lower than Yang et al. (2006) in Jinghai yellow chicken and Egena et al. (2014) in indigenous Nigerian chickens. All these variations might be due to breed differences.
Table 1: Descriptive statistics of body weight and linear body measurements traits of Hy-Line silver brown commercial layer.
| Trait | Mean±SE | STD | Minimum | Maximum |
| BW (Kg) | 1.41 ± 0.02 | 0.20 | 1.10 | 2.00 |
| WL (cm) | 16.57 ± 0.58 | 5.21 | 9.60 | 22.50 |
| BK (cm) | 2.85 ± 0.04 | 0.39 | 2.10 | 3.60 |
| SL (cm) | 9.07 ± 0.06 | 0.58 | 7.40 | 10.10 |
| BG (cm) | 38.89 ± 0.43 | 3.84 | 34.51 | 47.00 |
| BL (cm) | 37.29 ± 0.18 | 1.64 | 32.60 | 39.50 |
SE: Standard error; STD: Standard deviation; BW: Body weight; WL: Wing Length; BK: Beak length; SL: Shank Length; BG: Body girth; BL: Body length.
Correlation between measured traits
Pearson correlation was employed to investigate the relationship between body weight and linear body measurement traits of Hy-Line silver brown commercial layer.
Figure 2 shows the Pearson correlation between body weight and linear body measurement traits of Hy-Line silver brown commercial layer. The results indicated that body weight had a highly negative significant correlation with wing length (r = -0.48, P <0.01) and body length (r = -0.61, P <0.01). Shank length had a non-significant correlation with all the other measured traits viz; body weight (r = 0.07), beak length (r = 0.06), wing length (r = -0.01) and body length (r = -0.12) except body girth (r = 0.21, P <0.05), respectively. The results also revealed that there was a highly negative correlation between body girth and beak length (r = -0.74, P <0.01). Highly positive significant correlation was observed only between body length and wing length (r = 0.55, P <0.01). These results were contradicting with Egena et al. (2014), Tyasi et al. (2017) and Semakula et al. (2011). The differences can be attributed to breed, environmental conditions and management variations. Correlation results suggest that body weight of Hy-Line silver brown commercial layer had a relationship with wing length and body length. Therefore, wing length and body length might be used for selection in the breeding of Hy-Line silver brown commercial layer.
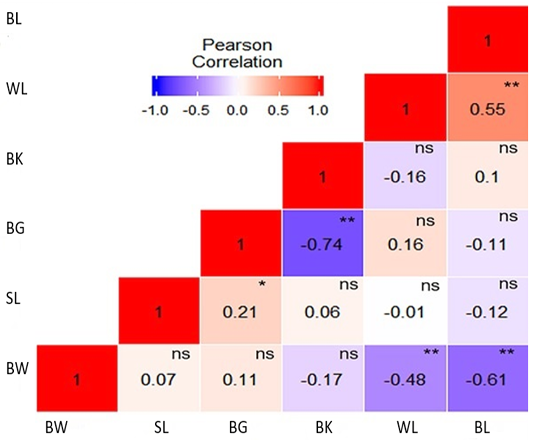
Figure 2: Heat map of correlation of body weight and body measurement traits of Hy-Line silver brown commercial layer. Pearson correlation colour illustration, a high correlation is red, mid correlation is white and low correlation is blue. Body weight: BW, Beak length: BK, Body length: BL, Body girth: BG, Shank length: SL, Wing length: WL, * significant at P < 0.05, ** significant at P < 0.01 and ns not significant.
Multivariate adaptive regression splines data mining algorithm
Correlation coefficient does not provide the effect of linear body measurement traits on body weight. Hence, it is vital to use Multivariate Adaptive Regression Splines data mining algorithm to estimate the effect of linear body measurement traits on body weight of Hy-Line silver brown commercial layer. The current study was conducted to investigate the effect of linear body measurement traits on the body weight of Hy-Line silver brown commercial layer by using MARS data mining algorithm. The model (Table 2) constructed by MARS data mining algorithm indicated that wing length, body length and beak length were included in the model where body girth and shank length were excluded. MARS model constructed 21 basic functions with 8 for single order term variable effect and 12 order of interactions with an intercept coefficient of 12.673. Multivariate Adaptive Regression Splines explained the effect of wing length, body length and beak length with negative and positive coefficients on body weight. In short; the effect on body weight of Hy-Line silver brown commercial layer was increased when computed WL > 19.2 cm and model coefficient reaching 5.306. The effect on body weight was on the positive direction and the model coefficient was 1.778 when BL >19.6 cm and was 2.386 when BL >19.6 cm. In addition, the results also indicated the effect of linear body measurement traits interactions on body weight of Hy-Line silver brown commercial layer. Thus, the effect on Body Weight was on the positive direction and model coefficient was 0.132 when WL >10.3 cm and BL greater than 21.2 cm. The effect on Body Weight was 8.831 when WL >20.5 cm and BL >20 cm. The interaction between WL and BL also showed that the model coefficient was 0.333 and 0.198 when BL < 21.5 cm and 21.2 cm < WL > 21.2 cm respectively. MARS model also revealed that when the beak length was included in the model, the effect on body weight was 0.000 when BL < 21.5 cm and WL > 2.98 cm. The results suggest that wing length and body length had an effect on body weight of Hy-Line silver brown commercial layer. MARS data mining algorithm results revealed the goodness of fit criteria as follow: Coefficient of determination (R2) = 1, adjusted coefficient of determination (R2 adj.) = 1, standard deviation ratio (SD ratio) = 0.006, root mean square error (RMSE) = 0.001 and Pearson correlation (r) = 1 between predicted and actual values (P < 0.01) of body weight. MARS results produced the lowest generalized cross-validation error (GCV) = 0.000001.35. These findings suggest that 100% of variance of body weight in Hy-Line silver brown commercial layer explained by MARS model, predicted and actual values of body weight had a positive high correlation which means MARS model is the best model to predict body weight of Hy-Line silver brown commercial layer. The results further showed the lowest RMSE, SD ratio and GCV with the highest R2 which indicates that MARS model is the best model. Based on prior knowledge, this is the first study on prediction of body weight from linear body measurement traits in chickens using multivariate adaptive regression splines data mining algorithm. However, similar findings in other animals were discovered for good fit criteria in prediction of body weight through Multivariate Adaptive Regression Splines in Pakistan goats (Celik, 2019) R2 = 0.91, R2 adj. = 0.86, RMSE = 3.32, r = 0.95 and SD ratio = 0.30, in Mengali rams (Celik, 2019) R2 = 0.88, R2 adj. = 0.87, r = 0.94 and SD ratio = 0.35, in Turkish Tazi dogs (Celik and Yilmaz, 2017) R2 = 0.92, R2 adj. = 0.90, RMSE = 0.60, r = 0.96 and SD ratio = 0.28 and in Daera Din Panah goats (Celik et al., 2018) R2 = 0.970, R2 adj. = 0.960 and RMSE = 1.202. Furthermore, Grzesiak and Zaborski (2012) used MARS data mining algorithm for defining the factors affecting final fattening live weight in cultural beef cattle enterprises and found a good fit criterion of R2 = 0.98, r = 0.99 and SD ratio = 0.11. Previous study (Vincent et al., 2015) recommended that the MARS model ought to have a standard deviation ratio of less than 0.40 or between 0 and 0.10 have a good or very good fit.
Table 2: Multivariate adaptive regression splines algorithm for body weight in Hy-Line silver brown commercial layer.
| BF | Equations | Coefficients |
| Intercept | 12.673 | |
| BF1 | max (0; WL-10.3) | -1.292 |
| BF2 | max (0; 19.2-WL) | -1.294 |
| BF3 | max (0; WL-19.2) | 5.306 |
| BF4 | max (0; WL-21.3) | -0.771 |
| BF5 | max (0; BL-19.6) | 1.778 |
| BF6 | max (0; BL-20) | -6.445 |
| BF7 | max (0; 21.5-BL) | -3.344 |
| BF8 | max (0; BL-21.5) | 2.386 |
| BF9 | max (0; WL-10.3) * max (0; BL-21.2) | 0.132 |
| BF10 | max (0; WL-10.3) * max (0; 21.2-BL) | -0.023 |
| BF11 | max (0; WL-10.3) * max (0; BL-21) | 0.277 |
| BF12 | max (0; WL-19.2) * max (0; BL-21) | -1.269 |
| BF13 | max (0; WL-19.2) * max (0; 21-BL) | -0.351 |
| BF14 | max (0; 20.5-WL) * max (0; BL-19.6) | -0.076 |
| BF15 | max (0; 20.5-WL) * max (0; BL-20) | 0.551 |
| BF16 | max (0; WL-20.5) * max (0; BL-19.6) | -8.583 |
| BF17 | max (0; WL-20.5) * max (0; BL-20) | 8.831 |
| BF18 | max (0; 21.2-WL) * max (0; 21.5-BL) | 0.333 |
| BF19 | max (0; WL-21.2) * max (0; 21.5-BL) | 0.198 |
| BF20 | max (0; 21.5-BL) * max (0; BK-2.98333) | 0.000 |
| BF21 | max (0; 21.5-BL) * max (0; 2.98333-BK) | 0.000 |
BF is basic function; BK: Beak length (cm); BL: Body length (cm), WL: Wing length (cm).
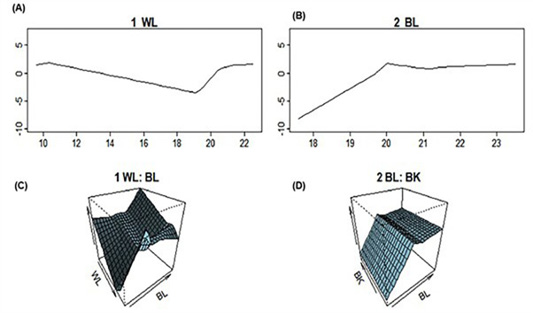
Figure 3: Graphical representation of the terms composing the MARS model for body weight using linear body measurement traits of Hy-Line silver brown commercial layer. (A) first order term of the predictor linear body measurement trait wing length (WL); (B) first order term of the predictor linear body measurement trait body length (BL); (C) second term order of the linear body measurement traits wing length (WL) and body length (BL); (D) second term order of the linear body measurement traits body length (BL) and beak length (BK).
Graphical representation of MARS model (Figure 3) indicated the most important linear body measurement traits on prediction of body weight in Hy-Line silver brown commercial layer. Figure 3A revealed wing length (≥ 10 cm to ≤ 22 cm) be the first important linear body measurement traits in prediction of body weight followed by body length (Figure 3B) values ≥ 18 cm to ≤ 23 cm respectively. Figure 3C revealed the first term order of interaction between the linear body measurement traits (WL and BL) and their directions while Figure 3D showed the second term order interaction between beak length and body length and their directions on prediction of body weight. Multivariate Adaptive Regression Splines studies in animal breeding (Grzesiak and Zaborski, 2012; Eyduran et al., 2017; Celik, 2019) did not focus on representing the effect of predictor variables on body weight using MARS model graphically. However, Nieto et al. (2015) indicated that the graphical representation of MARS gives a clear understanding of the most important predictor variables. Additionally, Aksoy et al. (2018) who investigated the prediction of students’ science achievements using multivariate adaptive regression splines indicated that the graphical representation of MARS model shows a clear understanding of the importance of predictor variables. The limitation of the present study was that; few literature was found in the modelling of MARS in animal studies. However, more studies need to be done for the prediction of body weight in animals using MARS model. There are limited studies in MARS modelling as data mining algorithm in chickens. However, similar data mining algorithm technique such as classification and regression tree (CRT) has been conducted in chicken studies. Tyasi et al. (2020) conducted CRT modelling to estimate the body weight of Potchefstroom Koekoek chicken layers and concluded beak length, wing length and back length play an significant role in the body weight of Potchefstroom Koekoek laying hen chickens. Yakubu and Madaki (2017) also conducted CRT modelling the growth of dual-purpose Sasso hens and established that CRT model showed a body weight of greater than 32.5 grams and below 47.5 weeks of age with R2 value of 93%.
Correlation coefficient was used to investigate the relationship between body weight and linear body measurement of Hy-Line silver brown commercial layer. Correlation findings suggest that wing length and body length had a significant high correlation with body weight. The effect of linear body measurement traits on body weight was investigated by using Multivariate Adaptive Regression Splines data mining algorithm and the results showed that wing length and body length had an effect on body weight of Hy-Line silver brown commercial layer. MARS models established in this study might be used by chicken layer farmers during breeding for selection. Further studies need to be done to investigate the effect of linear body measurement traits on body weight of chicken breeds using Multivariate Adaptive Regression Splines data mining algorithm.
ACKNOWLEDGEMENTS
All the authors wish to express the appreciation for financial support from the University of Limpopo (UL), School of Agricultural and Environmental Sciences (SAES), Department of Agricultural Economics and Animal Production (AEAP) and to the UL Experimental Farmworkers for their assistance during data collection.
AUTHORS CONTRIBUTION
TLT designed the experiment, analysed the data and wrote the manuscript. KMM, KM, TLR, MCM, LWD, KMM, PMB, NDM and DM performed fieldwork and wrote the manuscript. KMM, TLR, MCM and KM reviewed the manuscript. TLT read, edited and approved the final manuscript.
Conflict of interest
The authors have declared no conflict of interest.
REFERENCES


