Advances in Animal and Veterinary Sciences
Research Article

Color-Doppler Ultrasonography to Predict the Moment of Ovulation in the Bitch
Amir Mansour¹*, Mohamed Cherif Abdeldjelil², Hithem Bougherara³, Djamel Khellaf¹, Adel Aissi³
¹Higher National Veterinary School of Algiers, Algeria; ²Laboratory, P.A.D.E.S.C.A, University of Mentouri, Constantine1, Algeria; ³Surgery and veterinary imaging service, Batna -1- University, Algeria.
Abstract | We used a color-coded Doppler ultrasound procedure to determine the exact moment of ovulation during the preovulatory phase in 10 bitches. Preovulatory changes in the coloured area were converted into pixels and calculated using image processing software (ImageJ). The number of pro-oestrus follicles and the diameter of the preovulatory follicles were calculated for both ovaries of each bitch pro-oestrus preovulatory. A significant increase in colored surfaces was observed over the preovulatory period, which reached a maximum on the day of ovulation (p < 0,0001). However, the mean results of the colored area on the day of ovulation showed an increased standard deviation (±600,804 pixels for the left ovary and ±647,240 pixels for the right one) and a sizeable statistical range (1770 pixels for the left ovary and 1950 pixels for the rignt one) , making it impossible to determine a threshold to predict the exact moment of ovulation. Further to this, statistical analysis revealed no correlation between the number of pro-oestrus follicles and the intensity of blood flow, as well as between follicular diameter and the intensity of blood flow at the time of ovulation.
Keywords | Bitch, Ovulation, Color doppler, Blood flow, Follicular diameter
Received | December 23, 2019; Accepted | March 03, 2020; Published | June 26, 2020
*Correspondence | Amir Mansour, Higher National Veterinary School of Algiers, Algeria; Email: a.mansour@etud.ensv.dz
Citation | Mansour A, Abdeldjelil MC, Bougherara H, Khellaf D, Aissi A (2020). Color-doppler ultrasonography to predict the moment of ovulation in the bitch. Adv. Anim. Vet. Sci. 8(7): 782-787.
DOI | http://dx.doi.org/10.17582/journal.aavs/2020/8.7.782.787
ISSN (Online) | 2307-8316; ISSN (Print) | 2309-3331
Copyright © 2020 Mansour et al. This is an open access article distributed under the Creative Commons Attribution License, which permits unrestricted use, distribution, and reproduction in any medium, provided the original work is properly cited.
Introduction
The domestic dog (Canis familiaris) is a non-seasonal monoestrus species that present spontaneous ovulation. The bitch’s reproductive cycle is very typical, where significant variations do occur between and within dogs. The duration of the different phases of the cycle, such as pro-oestrus and oestrus can vary from 5 to 20 days and 6 to 11 days, respectively and, therefore, these variations explain poorly known breeding dates (Concannon, 2010). The fertile period can sometimes extend from 5 days before and after ovulation (Levy et al., 2007). On the other hand, the male’s sperm lifespan is very short, and studies have shown that, after freeze-thaw, the percentage of motile and viable sperm decreases up to 45% (Thomassen et al., 2006). Hence, it become utmost important to precisely determine the date of ovulation. For subject matter, there are several techniques available to predict the time of ovulation, and these include vaginal epithelium exams, hormone dosage, or ovarian ultrasonography. Vaginal cytology determines the phases of the oestrus cycle. Supplemented with a hormone test, it is most often used to monitor the onset of the period when ovulation date approaches (Bouchard et al., 1991). However, due to variations in cycles between and within bitches, ovulation cannot be determined with precision by this method (Rosset et al., 2009). The LH blood test performed by radio-immunological method (RIA) or by ELISA test is another method to be used. However, owing the fact that blood LH surge has a short duration, its detection is so delicate to a point where it is often necessary to carry out daily blood tests (ideally two blood samples) until the surge detection (England et al., 2002; Levy et al., 2007). In addition, some studies have shown that the LH surge is sometimes biphasic where an initial rise needs not to be taken into account in determining the date of ovulation (Jeffcoate and Lindsay, 1989). Monitoring blood progesterone levels can also be used to infer the time of the LH surge. Indeed, due to typical preovulatory luteinization in this species, this method can predict the day of ovulation prospectively (Jeffcoate and England, 1997; Hase et al., 2000). However, most practitioners do not have the necessary equipment to carry out these quantitative assays. Also, a use of semi-quantitative colorimetric kits (ELISA method) does not allow an exact value of progesterone in blood (Arbeiter et al., 1991). Ovarian ultrasonography can visualize the evolution of the ovaries’ appearance during the oestrus cycle, where a gradual increase in their diameter is correlated with an increased estrogen secretion (Hayer et al., 1997). However, studies have shown that, in the moments before and after ovulation, the follicular structures present very similar aspects (England et al., 2003). Some follicles do not collapse at the time of ovulation (Fontbonne et al., 2008) while non-ovulated follicles often persist afterwards and can remain up to three days after ovulation (Wallace et al., 1992).
The ovary is the most perfused organ in the body (Ellinwood et al., 1978). In several species, during the oestrus cycle, numerous histological studies have revealed variations in ovarian vascularity, in relation to the functional stages (Basset, 1943; Andersen and Simpson, 1973; Ellinwood et al., 1978; Peters and McNatty, 1980). The aim of this study was to test a non-invasive convenient method to predict the moment of ovulation in the bitch. Using transabdominal Color-Doppler Ultrasonography, the technique is based on evaluating intra-ovarian blood flow variations during the female’s oestrus cycle. The brightness of the coloured surfaces reflects the blood flow intensity in the ovarian parenchyma. Calculating these surfaces’ areas using an image analysis software, would constitute an objective method to evaluate the changes enough to predict the moment of ovulation.
MATERIALS AND METHOD
Animals
Procedures used in this study were according to international guidelines for the care and use of animals in research and teaching (N.I.H. publications no 85-93 revised 1985).
Examinations were carried out on ten healthy bitches with age ranging from nine months to six years. Animals belonged to different breeds and included Belgian Shepherd Malinois (n=7), German Shepherd (n=2) and Dutch Shepherd breed (n=1). Depending on the breed the weight of the animals varied between 23kg and 31.5 kg with an average of 27.3kg. Each of the bitch belonged to the Reproduction and Cynotechnical Training Centre of the Algerian National Gendarmerie in Aïn Benian (Algiers). Animals were maintained under standard management practices, and were fed with dry kibble : Happy Dog© Profi Line -Sportive, 26% proteins, 16% fat (Interquell GmbH pet food, Germany). With quantities respecting the manufacturer’s guidelines for each animal’s body weight. A follow-up of the cycle of one dog took about 20 days. The total study extended from May 24th, 2016 to June 12th, 2017.
No oestrus induction method was used in this experiment.
Experimental Design
A combination of vaginal smears and ultrasound examinations were performed on the bitches. Females showing physical signs such as vulvar swelling and vaginal bleeding were subjected to a follow-up vaginal cytology exams to determine the onset of the pro-oestrus stage. Once the pro-oestrus was confirmed by vaginal cytology, an ultrasound examination of the subject animal was conducted. The frequency of these exams was determined by the stage of the pro-oestrus. The investigation was held at a frequency of every two days during the onset and the middle of the pro-oestrus, and once daily at the end of the pro-oestrus when the follicles reached a diameter greater than 4.5 mm (Holst and Phemister, 1974).
Vaginal Cytology
Standard vaginal smear preparations were performed. Cotton swabs were used for sampling. The cells on the cotton swab were transferred onto a slide and were rapidly stained with Diff Quick stain (Jeffcoate and Lindsay, 1989). Based upon the gradual shift from intermediate and para-basal cells to superficial cells, microscopic examination of cells was used to determine early to late pro-oestrus stages.
Ultrasonography
A B-mode ovarian ultrasound examinations were performed using a MyLab ™ Five V.E.T. Ultrasound (Günzel-Apel and Dieterich, 1996). The device was equipped with a linear array transducer of 7.5mhz frequency. The number of preovulatory follicles, their sizes, as well as their aspects during the ovulatory period, were noted. Using the same ultrasound, a Doppler Color-Flow-Mapping was performed to visualize intra-ovarian vascularization. The size of the color-coded area was generally limited to the maximum extent of the ovary. Blood flow was assessed in the ovarian parenchyma when the stream was visible without artifact.
Image Analysis
All images were transferred to a computer and saved as JPEG for analysis using ImageJ software (version 1.33) (open source image processing program: https://imagej.net/). A quantitative analysis of ovarian vascular perfusion was performed. The colored parts indicating ovarian blood flow were converted into pixels, and their area was calculated. For each animal, the calculated field concerning images was collected for four preovulatory days (D-4, D-3, D-2, and D-1), the day of ovulation, and a day post ovulation (D+1). All procedures (Ultrasound monitoring and pixel area calculating) were carried out by the same practitioner to minimize personnel variability.
Statistical Analysis
Statistical analysis was performed by X.L.S.T.A.T. 2019 software (Addinsoft S.A.R.L.). Obtained data were expressed as mean ± S.D. Statistical analysis was performed using the Kruskal-Wallis test, followed by the Dunn-Bonferroni Post-Hoc method. P-value < 0.05 was considered significant. A correlation study between the colored Doppler area at the time of ovulation, the number of follicles in pro-oestrus, and the diameter of the preovulatory follicles were carried out.
RESULTS
An increased variations in ovarian parenchyma blood flow were recorded. These variations started at day four before ovulation and reached at its maximum on the day of ovulation (Figure 1) (Figure 2). A significant difference p <0.05 was noted between D-4, D-3 and the day of ovulation for both ovaries (Table 1) (Table 2).With an average number of 4.6 follicles number of visualized preovulatory follicles varied from 3 to 7 follicles per ovary. Preovulatory follicles size ranged from 5.1 mm to 6.8 mm and had an average size of 5.8 mm (Table 3).
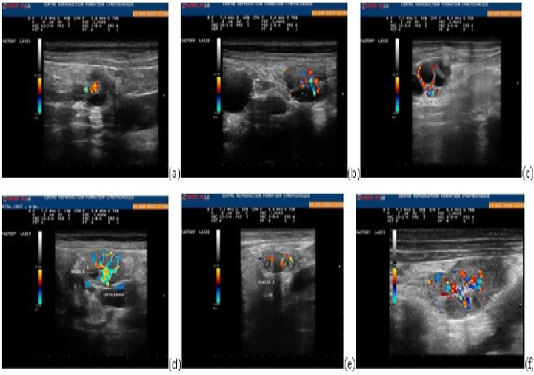
Figure 1: Ovarian parenchyma color-Doppler ultrasonographic images showing blood flow changes during the different phases of the cycle: end of the proestrus (a), three days before ovulation (b), one day before ovulation (c), ovulation (d), one day after ovulation (e), four days after ovulation (f).
A lack of correlation was observed between the number of the preovulatory follicle and the colored Doppler area (pixel) on the day of ovulation (Figure 3). Similarly, a lack of correlation was observed between the diameter of the preovulatory follicle and the colored Doppler area (pixel) on the day of ovulation (Figure 4).
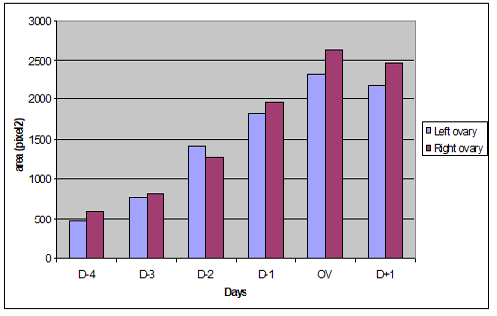
Figure 2: Evolution of the colored Doppler area (pixel) during the pre and post ovulatory phase in the left and right ovaries.
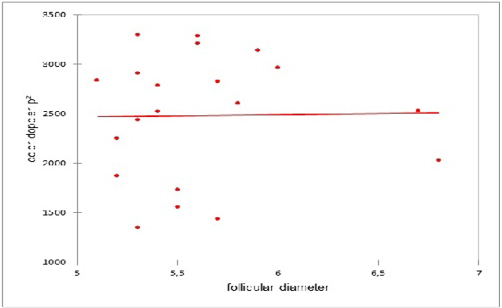
Figure 3: Correlation between the number of the preovulatory follicle and the colored Doppler area (pixel) on the day of ovulation
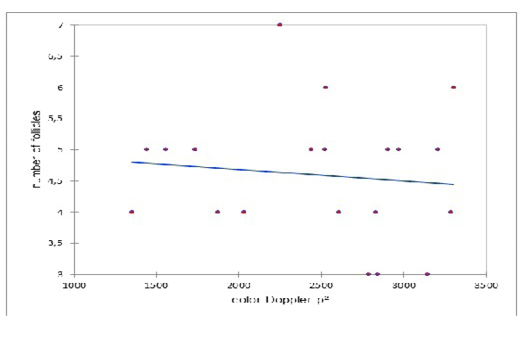
Figure 4: Correlation between the diameter of the preovulatory follicle and the colored Doppler area (pixel) on the day of ovulation
Table 1: Mean area of ovarian blood flow (pixels) in the left ovary starting from preovulatory day D- 4 to postovulatory day D+1
| Days | Mean ± SD | Minimum | Maximum |
| D-4 |
466,875 ±162,018 a |
259,000 | 711,000 |
| D-3 |
764,300 ±169,877 a |
482,000 | 1079,000 |
| D-2 |
1404,700 ±421,553 a-b |
847,000 | 1982,000 |
| D-1 |
1813,800 ±323,689 b |
1407,000 | 2278,000 |
| Ovulation |
2330,800 ±600,804 b |
1440,000 | 3210,000 |
| D+1 |
2188,700 ±578,513 b |
1259,000 |
3097,000 |
a–b means without a common superscript differed (P < 0.05).
Table 2: Mean area of ovarian blood flow (pixels) in the right ovary starting from preovulatory day D- 4 to postovulatory day D+1
| Days | Mean ± SD | Minimum | Maximum |
| D-4 |
590,875 ±271,662 a |
233,000 | 1119,000 |
| D-3 |
805,100 ±266,973 a |
358,000 | 1220,000 |
| D-2 |
1263,800 ±660,209 a-b |
305,000 | 2507,000 |
| D-1 |
1964,200 ±491,985 b |
1303,000 | 2592,000 |
| Ovulation |
2630,800 ±647,240 b |
1351,000 | 3301,000 |
| D+1 |
2467,200 ±648,981 b |
1242,000 |
3145,000 |
a–b means without a common superscript differed (P < 0.05).
Table 3: Number of follicles in the proestrus and size of pre-ovulatory follicles (mm) of the left and right ovaries
| Number of follicles in the proestrus | Size of pre-ovulatory follicles (mm) | |||
| Animal ID | Right | Left | Right | Left |
| Bitch 1 | 6 | 5 | 5.3 | 5.4 |
| Bitch 2 | 5 | 3 | 5.3 | 5.1 |
| Bitch 3 | 3 | 5 | 5.9 | 6 |
| Bitch 4 | 5 | 7 | 5.3 | 5.2 |
| Bitch 5 | 4 | 4 | 5.7 | 5.8 |
|
Bitch 6 |
4 | 5 | 5.3 | 5.6 |
| Bitch 7 | 5 | 5 | 5.5 | 5.5 |
| Bitch 8 | 4 | 5 | 5.6 | 5.7 |
| Bitch 9 | 6 | 4 | 6.7 | 6.8 |
| Bitch 10 | 3 | 4 | 5.4 | 5.2 |
DISCUSSION
Based upon the importance of blood flow changes in the ovarian parenchyma, the study was conducted to predict precisely the moment of ovulation in the bitch. For subject matter, colored area, shown by color Doppler ultrasound, were converted into pixels to permit an objective assessment of blood flow. Ovarian ultrasonography exams were performed exclusively at the late pro-oestrus stage. This is because the examinations performed on early pro-oestrus are difficult to realize, simply due to the very small size of ovaries, which make it difficult to identify in the abdominal cavity (Fontbonne, 2008; Le Fresne, 2010). Preovulatory follicles size ranged from 5.1 mm to 6.8 mm, with an average size of 5.8 mm. These values are similar to those reported previously by Fontbonne (2008) and Le Fresne (2010) who reported an average size of 5.9 mm and 5.3 mm, respectively. The number of visualized preovulatory follicles varied from 3 to 7 follicles per ovary, with an average number of 4.6 follicles. Similar findings are revealed previously by others. For instance, Fontbonne (2008) found 4 to 5 follicles on an average per ovary. Le Fresne (2010) reported an average of 2.7 follicles on the right ovary while 3.3 follicles on the left one. Several aspects of ovulation have been observed. These include ovulation with partial collapse (08 cases or 40%), ovulations with the formation of hypoechogenic structures showing irregular contours (05 cases or 25%), ovulations with the formation of anechoic cavity structures (04 cases or 20%), and finally ovulations with total collapse (03 cases or 15%). This last aspect of ovulation has much more been observed in other studies. For instance, Le Fresne (2010)reported a rate of 40 % in total collapse. On the other hand, Fontbonne (2008) reported 34.6% ovulation, while a 30% rate of ovulation was found by Wallace et al. (1991).
In our study, intra-ovarian Doppler Color-Flow-Mapping was difficult to perform five days before ovulation. On the 4th day before ovulation, except for both ovaries of bitch # 02, right ovary of bitch # 04, and left ovary of bitch # 07, blood flow was identified comfortably in majority of animals. In other studies, the coloured area has been observed 3 days before L.H. surge (Vermulen, 2009) and even 6 days before ovulation (Köster et al., 2001). Our results showed significant variations in ovarian parenchyma blood flow during the female’s oestrus cycle. The blood flow gradually increased during the follicular phase, particularly during the preovulatory period. It was marked by a significant increase in the observed coloured area which reached at its maximum on the day of ovulation, situation probably linked to the L.H. surge. In another study, Köster et al. (2001) observed a progressive increase in the speed of intra-ovarian blood flow during the follicular phase. The blood flow reached its highest values on the day of ovulation and at the beginning of the luteal phase. This increase in blood flow was accompanied by a decrease in resistance index and subsequently increased perfusion of the tissues (Rivers et al., 1997). In a similar study conducted on ten bitches, Vermeulen (2009) reported a gradual increase in the colored area during the preovulatory period, which reached a maximum two days after the L.H. surge. Several studies have confirmed a relationship between follicular growth and angiogenesis. For instance, according to Findlay (1986), the L.H. surge is responsible for the neo-vascularization of the granulosa layer around the preovulatory follicle. Hazzard et al. (2000) reported an involvement of L.H. in the synthesis of messenger R.N.A. of several angiogenic factors such as the fibroblastic growth factor FGF-2, vascular endothelial growth factors VEGF, and angiopoietins Ang -1 and Ang-2 in the granulosa cells of many animal species.
This angiogenesis may also be linked to oestrogen secretion. For instance, inducing in vitro neovascularization, Augustin (2000) demonstrated an involvement of estradiol 17-β in endothelial migration and proliferation . Hayer et al. (1993) revealed a correlation between progressive increase in follicular diameter and an increase in secretion of oestrogen. Niswender et al. (1975) linked the significant increase in follicular blood flow with an increased nutrient and oxygen needs of the preovulatory follicle. However, despite this significant evolution of the ovarian blood flow during the cycle, it was not possible to determine a threshold enough to predict an occurrence of ovulation. Indeed, during the preovulatory phase, the study results presented a statistical range combined with a high standard deviation value. Furthermore, in our study, statistical analysis revealed no correlation between the number of follicles in pro-oestrus and the intensity of the ovarian blood flow. Similarly, a lack of relationship was observed between follicular diameter size and the intensity of blood flow at the times of ovulation.
CONCLUSION
Using Color-Coded Doppler Ultrasound, monitoring blood flow variations in ovarian parenchyma confirmed a significant increase in blood flow during the preovulatory period. These changes correspond to follicular growth, which reached a maximum at the time of ovulation. However, during the preovulatory phase, obtained results presented statistical range with much extended standard deviation values and, therefore, did not permit to determine a threshold that can predict a reliable time of ovulation in the bitches.
ACKNOWLEDGMENTS
We would like to thank all the managers of the Algerian National Gendarmerie centre for Reproduction and Cynotechnical (in Aïn Benian- Algiers) for providing all the facilities necessary to carry out this study. We would also like to extend our thanks to all the employees of this centre for their contributions to the care of the dogs.
Conflict of interest
The authors declare that they have no conflict of interest.
authors contribution
Adel Aissi conceived and planned the experiments, supervised the findings of this work and approved the final manuscript. Amir Mansour, Hithem Bougherara and Adel Aissi, carried out the experiments. Amir Mansour and Mohamed Cherif Abdeldjelil, performed Image J software calculations and carried out statistical analysis of the data. All authors contributed to the interpretation of the results and to the drafting of the manuscript. Amir Mansour wrote the final manuscript in consultation with Mohamed Cherif Abdeldjelil and Adel Aissi
References


