Advances in Animal and Veterinary Sciences
Research Article

Comparative Analysis of Korean Native Chicken Populations using the Mtdna D-Loop Region Sequences
Sang-Hwan Kim, Jong-Taek Yoon*
Hankyong National University Korea, Republic.
Abstract | This study evaluated genetic distances and single nucleotide polymorphisms between Korean native chickens (KNC) and Southeast Asian chickens using mtDNA D-loop region control analysis. Originating from 36 chickens of three different populations, a DNA fragment (1231-1232 bp) from the mtDNA D-loop region was sequenced. A total of 34 variable sites with distinct 28 haplotypes were identified. Phylogenetic analysis indicated the clustering of KNC and Southeast Asia chickens with wild chicken breeds. However, Korean native chicken Red-line (KCR) did not diverge enough from Korean native chicken red with a black line (KCRD). Haplotype analysis showed ten different haplotypes with 19 SNPs among KCR and native Korean chicken Blackline (KCO). 90% of the variation diversity accounted for Korean native chicken populations with minimal differentiation among the individual strains. Chinese chicken breed-types were observed in KCRD and related breeds. Besides adding to the existing knowledge, the results of this study further ascertain verification and later commercialization of Korean native chickens.
Keywords | SNP, D-loop, haplotype, Native Korean chicken, Phylogeny
Received | June 02, 2020; Accepted | June 05, 2020; Published | June 25, 2020
*Correspondence | Jong-Taek Yoon, Hankyong National University Korea, Republic; Email: jtyoon@hknu.ac.kr
Citation | Kim SH, Yoon JT (2020). Comparative analysis of korean native chicken populations using the mtdna d-loop region sequences. Adv. Anim. Vet. Sci. 8(7): 735-741.
DOI | http://dx.doi.org/10.17582/journal.aavs/2020/8.7.735.741
ISSN (Online) | 2307-8316; ISSN (Print) | 2309-3331
Copyright © 2020 Kim and Yoon. This is an open access article distributed under the Creative Commons Attribution License, which permits unrestricted use, distribution, and reproduction in any medium, provided the original work is properly cited.
INTRODUCTION
Since 1952, Korean chicken breeds have improved. There are more than seven Korean native chickens or “traditional chicken” breeds that have been kept pure (Kang, 2010). Though molecular research tools such as next-generation sequencing have been developed recently (Eck et al., 2009), there is still a lack of original standards for Korean chicken population characterization, and their link to the traditional chickens of other regions remains to be elucidated. Mitochondrial DNA (mtDNA) has a circular double-helical structure that has little to no recombination potential due to its nuclear DNA-independent, maternal inheritance properties (Clayton, 1982; Mindell et al., 1997; Delport et al., 2002). The displacement (D)-loop control area is the central non-coding region of the mtDNA that contains a tandem repeat with specific sequence repeats unique for each species. Considering important in estimating maternal inheritance and identifying breeds due to its high evolutionary nature than other genes, it has also been used as a genetic marker (Lansman et al., 1983; Ki et al., 2009). Indeed, the nucleotide sequence in the mitochondrial D-loop area is one of the most essential and powerful molecular tools to track genetic information on old breeds of chicken, highlighting lineage incidence relationships, genetic distance, and variability within and between groups (Nishibori et al., 2005). There is no direct evidence that mtDNA is inherited by the matrilineage and can be recombined with other mtDNA molecules (Clayton, 1982; Nishibori et al., 2005). Therefore, this study aimed to estimate the genetic linkages and flexibility between traditional chickens bred in Gyeonggi-do and native chicken raised by the National Livestock Research Institute.
MATERIALS AND METHODS
Animals
Native red, native yellow-red, and black chickens were raised by the National Institute of Animal Science, Gyeonggi-do, Korea, and visually selected (Age : 8 week , Feather-colored phenotype, Cock) present study (Figure 1). Domestic broilers raised by the National Livestock Science Institute were used as experimental negative control group.
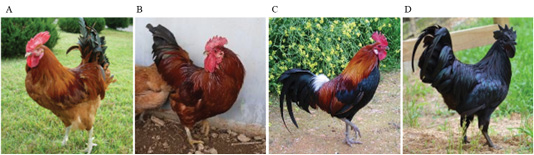
Figure 1: Plumage color classification criteria for Korean native chickens A: Korean Wild chicken (W), B: Korean native chicken Red-line (KCR), C: Korean native chicken red with black line (KCRD), D: Korean native chicken Black line (Ogol; KCO).
Sample Collection and Genomic Dna Extraction
Samples were collected by sacrificing ten randomly selected animals from each of the three groups, as described previously (Kang, 2010). The epidermal and muscular sections of the outer plume were collected and used in the experiment. For genomic DNA extraction, 250 mg of plume section of each native Korean chicken was crushed in liquid nitrogen, stored in 1.5 ml tubes, and DNA was extracted using the Easy DNA kit (Invitrogen, CA, USA) as per manufacturer’s instruction. For RNA elimination, 40 µg/ml of RNase was added to the extract, followed by incubation at 4℃ for 30 min. A 500 ng/µl of DNA was eluted, with a 260/280 ratio of 1.9 - 2.0, as measured using a spectrophotometer (Epoch, BioTek ins, VT, USA).
Mtdna D-Loop Amplification and Sequencing
A 465 bp fragment of the chicken mtDNA D-loop region was amplified by polymerase chain reaction (PCR) as described previously (Muchadeyi et al., 2008). Briefly, the reactions were prepared in a final volume of 20 μL containing 100 ng of sample DNA, 1×PCR buffer, 0.2 mM dNTPs, 0.5 U Taq DNA Polymerase, 1.5 mM MgCl2, 10 pM of primers (Table 1). The amplification consisted of an initial denaturation for 12 minutes at 94°C followed by 35 cycles of denaturation for 30 seconds at 95°C, annealing for 30 seconds at 53°C, and extension for 30 seconds at 72°C, and a final extension for 7 minutes at 72°C. The PCR products were separated by electrophoresis on 2% agarose gels. The amplicons were purified using a Qiamp Mini Kit (QIAGEN, Valencia, CA, USA). The purified samples were sequenced using a Big dye terminator chemistry kit and an ABI 3100 Avant Automated DNA Sequencer (Applied Biosystems, Foster City, CA, USA), and the DNA sequences were analyzed using the corresponding Sequencing Analysis Software Version 3.3 (Applied Biosystems, USA).
Analysis of Systematic Genetic Data
Base sequence data analysis and alignment of the D-loop control area was performed by the ClustalW2 (https://www.ebi.ac.uk/Tools/msa/clustalw2/) in the BioEdit Sequence Alignment Editor. Sequence divergence was calculated by the Kimura’s two-parameter (K2P) model, and the phylogenetic analysis was performed using the Neighbor-Joining (N.J.) method inMEGA6 program (Tamura et al., 2013). Mutation detection, genetic variability estimation, and haplotype calculation were performed using the DNA Sequence Polymorphism software named DNasp Ver. 5.1 (Librado and Rozas, 2009). The haplotype analysis was schematized in the NETWORK 4.6.1.2 program, as described previously (Bandelt et al., 1999).
Table 1: Description of the primers used in the current study for chicken mtDNA amplification and RACE reaction
| No. | Primer name | Sequences (5' to 3') |
| 1 | G.gallus_1F | CCCTCCCCATAGACAGTTCC |
| 2 | G.gallus_1R | CGAGGGACACGAGAGGACTA |
| 3 | G.gallus_2F | CTGCGTTGCGTCCTATCCTA |
|
4 |
G.gallus_2R | GTGGGTTAAGCTATGGGGGC |
| 5 | G.gallus_3F | TAGCAAACACAAAACCCGCC |
| 6 | G.gallus_3R | TAGGGCTAGGCATAGTGGGG |
| 7 | G.gallus_34F | CCAAAAATAACGCCAAGGAA |
| 8 | G.gallus_34R | GGGGGAGAACATGAGAGTGA |
RESULTS
Mtdna D-Loop Sequential Differences Between Native Korean and Traditional Southeast Asian Chickens
Table 2 compares the base sequence of each D-loop in mtDNA on nine native chickens in captivity at the National Institute of Animal Science and of the nine native chickens in Gyeonggi-do. Of the total 1231-1232 bp in the D-loop base sequence, single nucleotide polymorphisms (SNPs), with differences in the base transfer and substitution of a single base sequence, was found at 19 base areas. No difference was found between any individual groups; however, diversity observed among the groups. The wild type D-loop sequence analysis confirmed a base loss compared to other groups in sequences 48, 49, 50, 706, and 852, while the KCO group had base addition to 852. The KCRD, KCO, and KCR lines had a total of five base sections in a different sequence from the wild type. The KCRD and the KCO had changed at 167 (T/C), 212 (G/A), and 225 (T/C) bases. Additionally, variations at 315 (C/T) and 792(G/A) were confirmed in KCRD. The KCO had variations at 242 (G/T), 243 (T/C), 256 (T/C),
Table 2: mtDNA D-loop region sequence variations of 5 haplotypes of Samar RJFs and 17 haplotypes of Samar native chickens, derived from 5 and 43 individuals, respectively
| No. |
Mutation Site |
W | KCRD | KCR | KCO |
| 1 | 48 | gap | C | C | C |
| 2 | 49 | gap | C | C | C |
| 3 | 50 | gap | C | C | C |
| 4 | 167 | C | T | C | T |
| 5 | 210 | T | C | C | C |
| 6 | 212 | G | A | G | A |
| 7 | 225 | T | C |
T |
C |
| 8 | 242 | G | G | G | A |
| 9 | 243 | T | T | T | C |
| 10 | 246 | C | Y (C/T) | C | C |
| 11 | 256 | T | T | T | C |
| 12 | 281 | A | A | A | G |
| 13 | 315 | C | T | C | C |
| 14 | 363 | C | C |
C |
T |
| 15 | 367 | T | T | T | C |
| 16 | 686 | A | A | G | G |
| 17 | 706 | gap | G | G | G |
| 18 | 792 | G | A | G | G |
| 19 | 852 | gap | gap | gap | C |
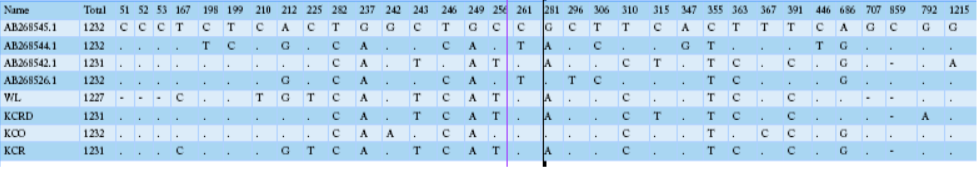
Table 3: The identified SNP positions and haplotypes using the mtDNA D-loop control region in Korean native chickens
NOTE.-- Models with the lowest BIC scores (Bayesian Information Criterion) are considered to describe the substitution pattern the best. For each model, the Akaike Information Criterion, corrected (AICc value), Maximum Likelihood value (lnL), and the number of parameters (including branch lengths) are also presented. Non-uniformity of evolutionary rates among sites may be modeled using a discrete Gamma distribution with 5 rate categories and by assuming that a certain fraction of sites is evolutionarily invariable (+I). Wherever applicable, estimates of gamma shape parameter and/or the estimated fraction of invariant sites are shown. Assumed or estimated values of transition/transversion bias (R) are also shown for each model. They are followed by nucleotide frequencies (f) and rates of base substitutions (r) for each nucleotide pair. Relative values of instantaneous r should be considered when evaluating them. For simplicity, sum of r values were made equal to 1 for each model. For estimating ML values, a tree topology was automatically computed. The analysis involved 40 nucleotide sequences. Codon positions included tion (+were 1st+2nd+3rd+Noncoding. All positions containing gaps and missing data were eliminated. There were a total of 1226 positions in the final dataset. Evolutionary analyses were conducted in MEGA6.
281 (A/G), 363 (C/T), 367 (T/C) and 852 (-/C) compared to other groups. Thus, each group seemed to have a different genetic evolution. The diversities of the haplotypes were formed at wild type 1, 2, 3, 5, 17. The haplotype 4, 6, 7 were found in KCR. The KCRD had haplotype 13, 16, 18, while it was 8, 9, 11, 12, 14, 15, and 19 in KCO.
Variation of Mtdna Base Sequence Between Exotic Species and Domestic Chickens
Sequence variation analysis of the mtDNA D-loop region (AB268545.1, AB268544.1, AB268542.1, AB2668526.1) and those of domestic chickens on the are shown in Table 3. Sequence AB268545.1 was found to have a different base sequence from that of the local species. On the other hand, sequence AB268526.1 showed a base substitution similar to that of the domestic species. The maximum likelihood fits analysis measured approximately 82 parameters and showed that the BIC contained a very high gene substitution from 4601.708 to 4760.966. The overall regression results showed increased changes in A.G., T.C., CT, and G.A. with particularly a high rate of base substitution (Table 4). The differences in base substitution between the species were found high using various analysis techniques. Therefore, it could be assumed that the distinction between varieties is possible.
Estimation of Genetic Diversity
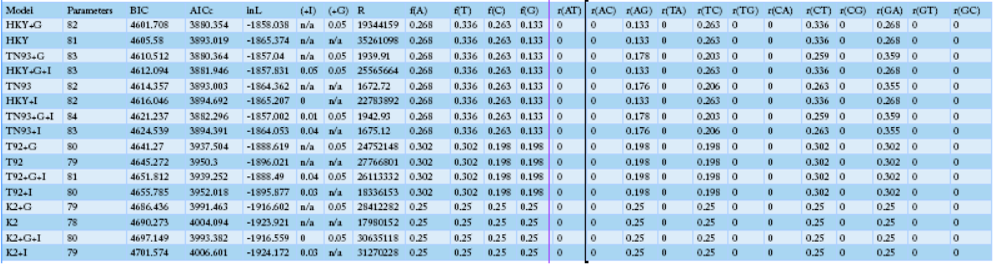
The leading indicators for assessing the genetic diversity of a variety or group includes values of the haplotype diversity (Hd) index and nucleotide diversity (Pi). The domestic haplotype analysis between alien and local chicken species was W (0.92387), KCRD (0.92364), KCO (0.92289), and KCR (0.92671). This confirms the genetic variation between indigenous and exotic species in Gyeonggi-do (Table 5). The NETWORK 4.6.1.2 program was used to schematize the haplotypes of two varieties, to identify the haplotype relationship between the traditional chicken (Wild type) and the indigenous chicken (KCO, KCR, KCRD) (Figure 1). Haplotype 1 drew a stretching out a schematic diagram of other haplotypes, confirming that the haplotype 1 group and the others were related (Figure. 2).
Genetic Distance (Mtdna D-Loop) Among the Individuals of Each Group
Table 6 correspond to genetic diversity among breed-type, where a more significant score indicates lower similarity, while the smaller score indicates a higher similarity (Saitou
Figure 2: Molecular phylogenetic analysis using maximum likelihood estimation and median-joining network profile of the haplotypes identified in Korean native chickens
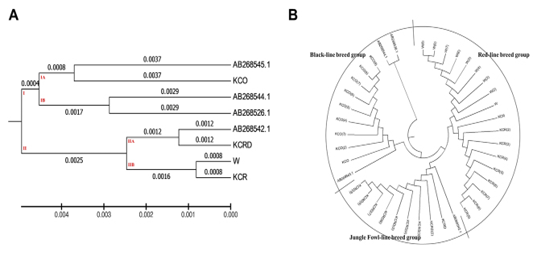
Figure 3: Evolutionary relationships of taxa. The evolutionary history was inferred using the UPGMA method 8The optimal tree with the sum of branch length = 0.02527212 is shown. The evolutionary distances were computed using the maximum composite likelihood method and are in the units of the number of base substitutions per site. The analysis involved 40 nucleotide sequences. Codon positions included were 1st+2nd+3rd+Noncoding. All positions containing gaps and missing data were eliminated. There were a total of 1226 positions in the final dataset. Evolutionary analyses were conducted in MEGA6.
and Nei, 1987). The genetic distance between the used A.B. group and the domestic species ranged between 0.025 - 0.116. The genetic distance between the local species ranged between 0.0016 - 0.0091. In particular, the distance between AB268545.1 and KCO was minimal, while
Table 5: Number of haplotype (h), haplotype diversity (Hd), and nucleotide diversity (Pi) of the D-loop control region sequences in Korean native chicken
| h | Hd | Pi | SS | NSS | |
| AB268545.1 | 4 | 0.92778 | 0.06816 | 279.83 | 938.17 |
| AB268544.1 | 4 | 0.92607 | 0.090591 | 28017 | 937.83 |
| AB268542.1 | 4 | 0.92633 | 0.019198 | 279.83 | 938.17 |
| AB268526.1 | 4 | 0.92587 | 0.041029 | 279.33 | 938.67 |
| W | 4 | 0.92387 | 0.060304 | 281 | 937 |
| KCRD | 2 | 0.92364 | 0.033482 | 280.33 | 937.67 |
| KCO | 4 | 0.92289 | 0.042664 | 280 | 938 |
| KCR | 2 | 0.92671 | 0.090487 | 280.5 | 937.5 |
Hd : Haplotype Distribution, SS: Synonymous sites, NSS: NonSynonymous sites
Table 6: Estimation of evolutionary divergence between sequences
| 1 | 2 | 3 | 4 | 5 | 6 | 7 | 8 | |
| AB268545.1 | ||||||||
| AB268544.1 | 0.0107 | |||||||
| AB268542.1 | 0.0107 | 0.0116 | ||||||
| AB268526.1 | 0.0082 | 0.0057 | 0.0091 | |||||
| W | 0.0116 | 0.0124 | 0.0057 | 0.0099 | ||||
| KCRD | 0.0099 | 0.0124 | 0.0025 | 0.0099 | 0.0049 | |||
| KCO | 0.0074 | 0.0099 | 0.0066 | 0.0074 | 0.0091 | 0.0074 | ||
| KCR | 0.0116 | 0.0107 | 0.0041 | 0.0082 | 0.0016 | 0.0049 | 0.0074 |
AB268542.1 was found to be very similar to the KCRD group. At each interval, the control group (W) had a genetic range very identical to the KCR group (0.0016). Other genetic distances were high, corresponding to a systematic variation. A total of two clusters were made at the presented genetic distance, exotic species were concentrated in sub-cluster of dual I.A. and I.B., and the KCO was distributed in I.B. clusters. Except for the KCO, including the sequence AB268542.1, all domestic species were concentrated in the cluster II (Figure 3).
DISCUSSION
In this study, we performed a sequence analysis for the genetic substitution and genetic distances in the mtDNA D-loop area to elucidate the genetic differences between domestic and native Korean and traditional Southeast Asian chickens. Native chickens in Korea were genetically related to a different region. Though there are various hypotheses about the chicken domestication process, based on the origin of chicken populations in Korea, it is believed that their common ancestor is the Red Jungle Fowl (Gallus gallus) from approximately 5400 B.C. (West and Zhou, 1989; Crawford, 1995). The mtDNA D-loop analysis of 31 traditional chicken groups, mainly in Yunnan China, reported that a number of wild chickens were involved in poultry domestication (Liu et al., 2006). Utilizing MS-Marker analysis, another study showed that India’s red jungle fowl is the ancestor of the currently known chicken (Kanginakudru et al., 2008). Based on the chicken mtDNA haplotype differences (Oka et al., 2007), the Japanese AB268545.1 had a maximum relatedness to the KCO line used in this study.
On the other hand, the KCRD line had a maximum relatedness with the Chinese AB268542.1 line. However, provided by the National Institute of Sciences and that of Gyeonggi-do, the typical native species were found to had a minimum relatedness to the Japanese and Chinese lines. Another Japanese line, AB268544.1, had a genetic distance similar to that of Indonesian chicken. The results showed that Indonesian chicken had a maximum genetic range from Japanese chicken. Southeast Asia based native chicken groups, which are red in Korea, differed from the Indonesian breed and shared and maternal line of Chinese origin (Liu et al., 2006). However, this result had some differences compared to several other studies that analyzed the existing genetic variation. For example, the study found a close relatedness for haplotype among W species and KCR but showed a higher genetic difference that varied from 0.025 - 0.116 with other exotic species. These results differed from those of Cho et al. (2011) and Kanginakudru et al. (2008). For native Gyeonggi-do, which is yellow-red, the result is similar to that of traditional Chinese chickens, which had approximately 0.9 haplotype domestic (Berthouly-Salazar et al., 2010). However, the results of the Tajima D-test estimated no significant difference between the hypothesis in all the groups. Cumulating these results, the origin of the Korean chicken seems to have similar maternal ancestors as those of the black chickens. They had the same genetic distance to the Japanese and other KCO (black). However, the W and KCR line had a genetic difference of 0.0012 - 0.0016 from those of Chinese chicken. The reason for such a difference in Hd is thought to be their settlement over a longer period. Therefore, based on the phylogenetic classification of species and the origins of Korean chickens, this study concludes that domestication in different regions happened differently. These results could be used as primary data to determine inheritance by the settlement of Korean chickens.
acknowledgements
This study was conducted materially in the Reproductive & Biotechnology Laboratory of the Hankyung National University in Korea.
Conflict of Interest
The authors declare that they have no conflict of interest.
Authors contribution
SH Kim have participated in developing the protocol, the sample granulosa cell, and in drafting the manuscript. SH Kim participated in the identification of the development of the database. SH Kim and JT Yoon contributed to the translation of the manuscript. JT Yoon supervised the analysis.
References


