Advances in Animal and Veterinary Sciences
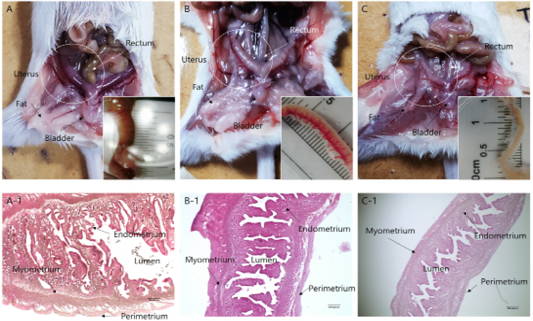
Anatomical and morphological changes in uterine tissues upon hormonal activation. (a–c) Morphological changes in the uterine tissue upon treatment with: (a) PMSG; (b) Progesterone and (c) Androgen. (a-1–c-1) Hematoxylin and eosin staining of the uterine endo/myometrium: (a-1) PMSG treatment; (b-1) Progesterone treatment; (c-1) Androgen treatment.
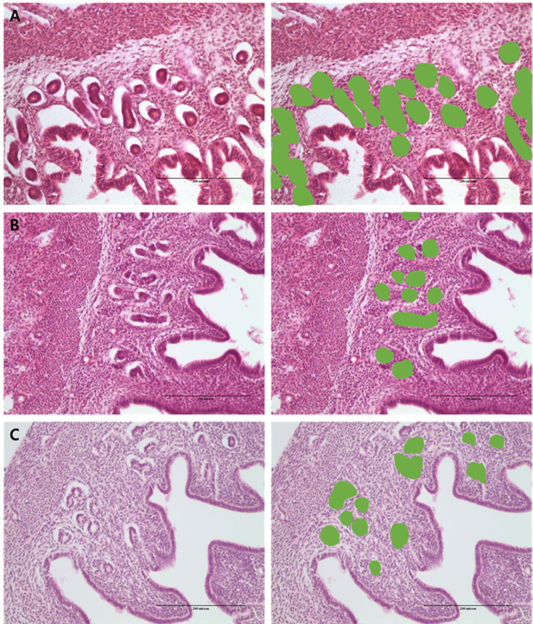
Morphometric measurement of % gland area using image analysis in the: (a) PMSG group; (b) P4 group and (c) Testosterone group.
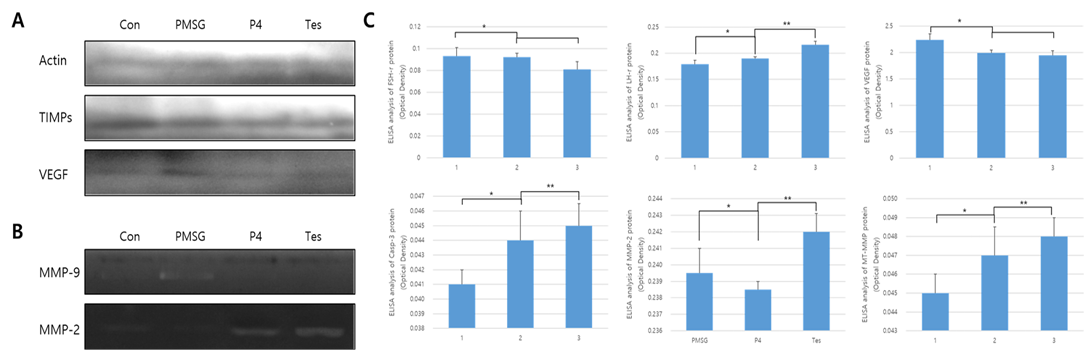
Protein expression and ELISA analysis of FSH-r, LH-r, VEGF, MT1-MMP, MMP-2, and TIMP-2 in different hormone treatment groups of the mouse uterus. ELISA experiments were repeated thrice and data are expressed as average fold change (mean±SD). (a) Western blot; (b) Zymographic analysis of MMP-9 and MMP-2; (c) ELISA analysis. *, ** Different letters within the same column represent significant differences (p < 0.05).
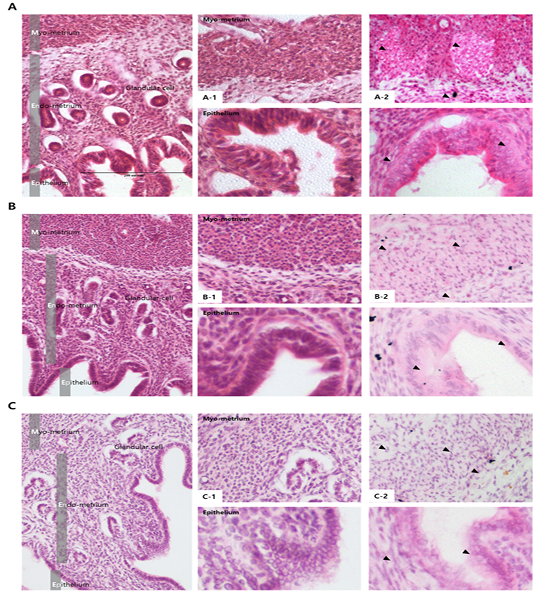
Analysis of MMP activation in different hormone treated groups of mouse uterine tissue. Black arrows indicate cells positive for MMP. Corpus luteum cells were counterstained with hematoxylin. Magnifications for the larger and smaller panels are ×200 and magnification x400 respectively. (a) PMSG treatment; (b) Progesterone treatment; (c) Androgen treatment; (a-1–c-1) Hematoxylin and eosin staining of the myometrium (upper panel) and the endometrium (lower panel), (a-2–c-2) In situ zymography analysis of the uterus.
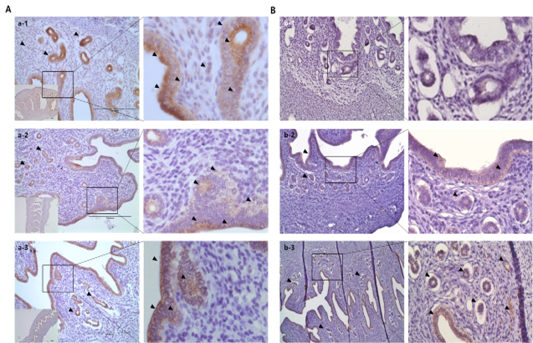
Immuno-localization of MMP-2 and TIMP-2 in the uterine tissue of different hormone treated groups. Black arrows indicate cells positive for MMP expression. Metrial cells were counterstained with hematoxylin. (a) MMP-2 localization; (b) TIMP-2 localization. (a-1–b-1) PMSG group; (a-2–b-2) P4 group; and (a-3–b-3) Testosterone group.


