Advances in Animal and Veterinary Sciences
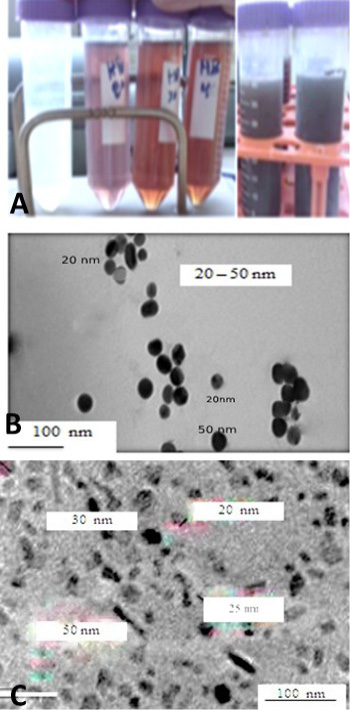
A: showed that the formation of AgNPs in colloid with different honey concentration and different PH 8.5 to 10.5. B: micrograph TEM of silver nanoparticles was demonstrated (spherical particles with particle size diameter < 50 nm. C: TEM micrograph of zinc oxide nanoparticles which showing prismatic shaped while others cubic shaped. The green silver and ZnONPs showed particle size ranged between 20 and 50 nm with the average particle size of 10–50 nm, respectively.
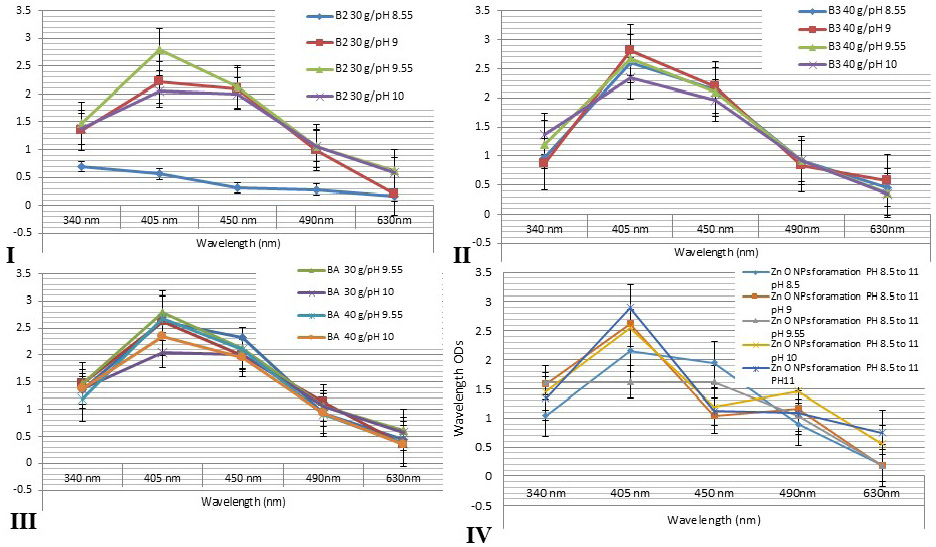
Showed that the spectrophotometer absorption wavelength value of AgNPs colloids for different honey concentrations gave a peak at wavelength level 405 and 450 nm. I: 30g at differences pH values at 8.55, 9, 9.55 and 10. II: 40 g honey concentrations at differences pH values. III: showed that the comparing results for different honeys concentrations at different pH values revealed nearly similar peak at wavelengths 405 and 450 nm for all honey groups. IV: showed that the comparing results for different green ZnONPs suspension at different pH values revealed nearly similar peak at wavelengths 405 and 450 nm for all olive leaves plant extracts.
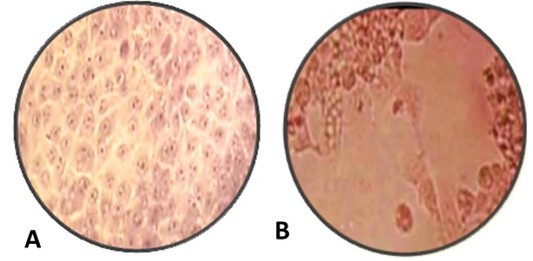
A: Normal MDBK cell culture non- infected or non-treated with nanoparticles, B: inoculated MDBK cell culture with suspected BoHV-1 virus 10 7 TCID 50% which showing cell rounding, cells aggregations and formation clusters of rounded cells cytopathic effect (CPE) stained with Hematoxylin and Eosin, (Magnification power 100X).
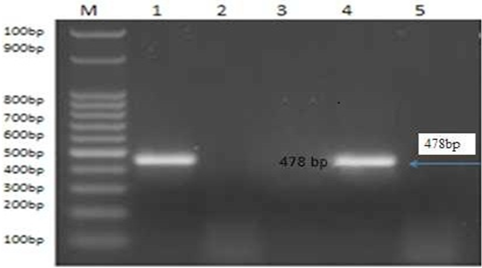
PCR product of the 478bp for amplified of BoHV-1 using primer for GI glycoprotein gene fragment, Lane M: 100bp ladder. Lane 1: control positive BoHV-1. Lanes 2: control negative samples Lanes 3 and 5: treated by AgNPs or ZnONPs inhibitory effect on BoHV-1 in experimentally infected rabbit from nasal swabs Lane 1: control positive BoHV-1. Lane 4: control positive group.
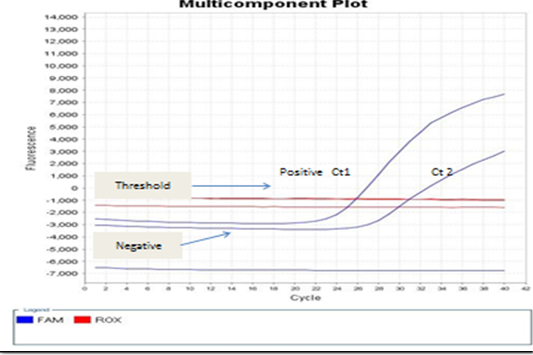
showed that the real-time PCR baseline subtractive Ct fit view of positive BoHV-1 1 DNA plotted against cycle number from left to right, Ct1 represents reactions containing copy number from nasal swabs of infected rabbit groups without treatment control positive group. No Ct curve denoted good inhibitory NPs effect on BoHV-1.


