Advances in Animal and Veterinary Sciences
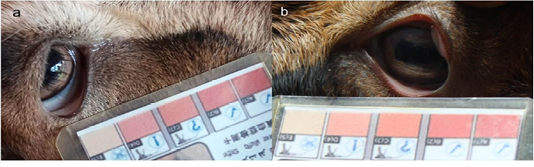
FAMACHA value of the treatment group. (a) Pre-treatment (value 5) (b) post-treatment (value 3).
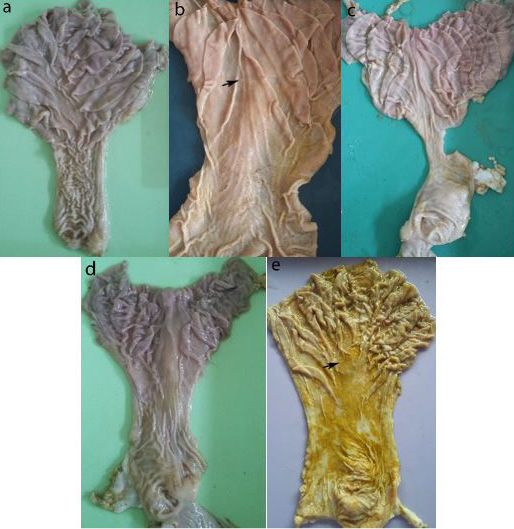
Mucosa abomasum control and treatment group. (a) positive control; (b) treatment 1, nodule (arrow); (c) treatment 2; (d) treatment 3; (e) negative controls, nodules (arrow).
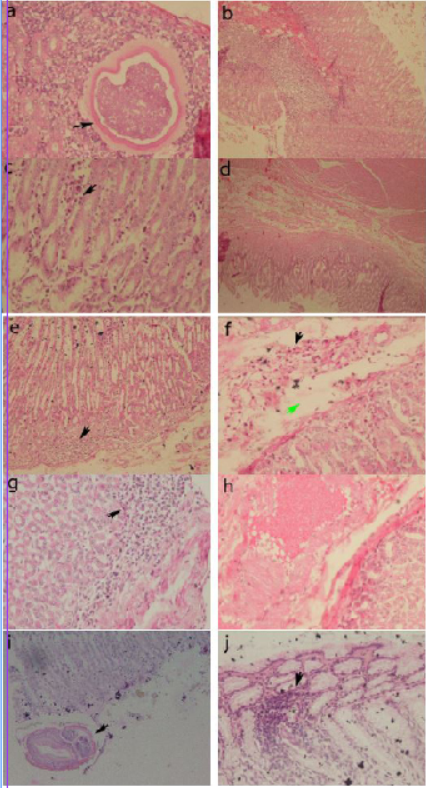
Histopathology of the abomasum control group. (a) positive control, larvae 4 in the submucosa (arrow) (40x); (b) positive control, congestion of blood vessels in the sub mucosa (20x); (c) group 1, infiltration of inflammatory cells in the sub mucosa (arrow) (40x); (d) group 1, edema in the sub mucosa (4x); (e) group 2, infiltration of inflammatory cells in the sub mucosa (arrow) (20x); (f) group 2, inflammatory cell infiltration (black arrow) and edema in the sub mucosa (green arrow) (40x); (g) group 3, infiltration of inflammatory cells in the sub mucosa (arrow) (40x); (h) group 3, congestion of sub mucosal blood vessels (40x); (i) negative control, cross section of adult worms in the mucosa (arrow) (20x); (j) negative control, infiltration of inflammatory cells in the sub mucosa (arrow) (40x).


