Advances in Animal and Veterinary Sciences
Research Article
Adv. Anim. Vet. Sci. 8(2): 183-189
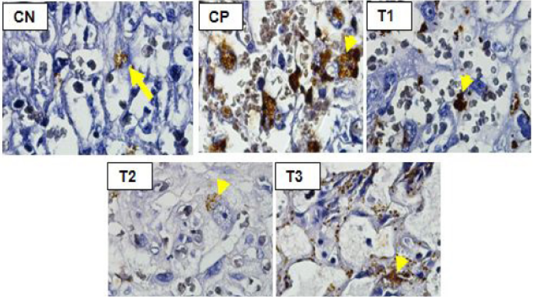
Figure 1
Differences in p53 expression in trophoblast cells (arrow) placenta between treatment.
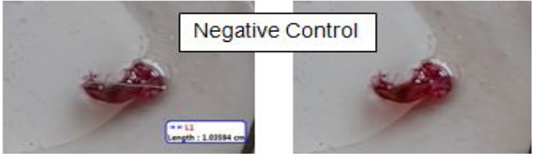
Figure 2
Difference in length and completeness of extremities (arrow) in foetus.
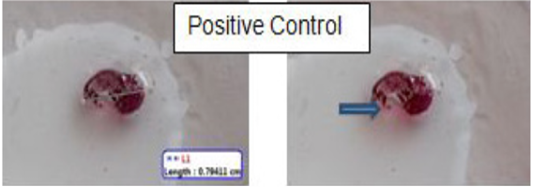
Figure 3
Difference in length and completeness of extremities (arrow) in foetus. The length of foetus in positive control is 0,82 cm.
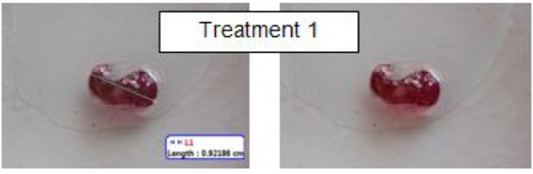
Figure 4
Difference in length and completeness of extremities (arrow) in foetus. The length of foetus in treatment 1 is 0,86 cm.
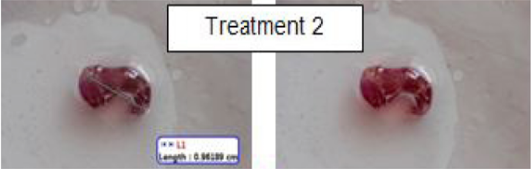
Figure 5
Difference in length and completeness of extremities (arrow) in foetus. The length of foetus in treatment 2 is 1,01 cm.
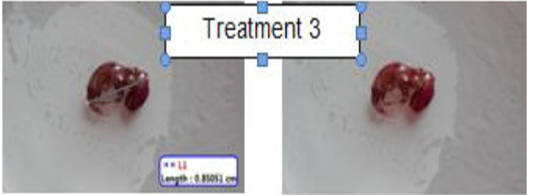
Figure 6
Difference in length and completeness of extremities (arrow) in foetus. The length of foetus in treatment 3 is 1,44 cm.


