Advances in Animal and Veterinary Sciences

Hypothalamic changes in gene expression (A-I). A. Hypothalamic AMPK, B. Hypothalamic ACC, C. Hypothalamic FAS, D. Hypothalamic CIC1, E. Hypothalamic CIC2, F. Hypothalamic IDH1, G. Hypothalamic IDH2, H. Hypothalamic Cytc and I. Hypothalamic GlyA. Relative expression was calculated as a percentage of the control value. Data are presented as means ± SEM. Means bearing different superscripts were significantly different at P < 0.05.
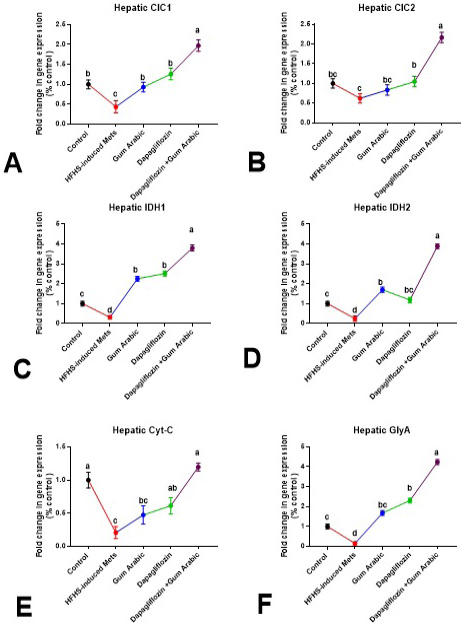
Hepatic changes in gene expression (A-F). A. Hepatic CIC1, B. Hepatic CIC2, C. Hepatic IDH1, D. Hepatic IDH2, E. Hepatic Cytc and F. Hepatic GlyA.Relative expression was calculated as a percentage of the control value. Data are presented as means ± SEM. Means bearing different superscripts were significantly different at P < 0.05.
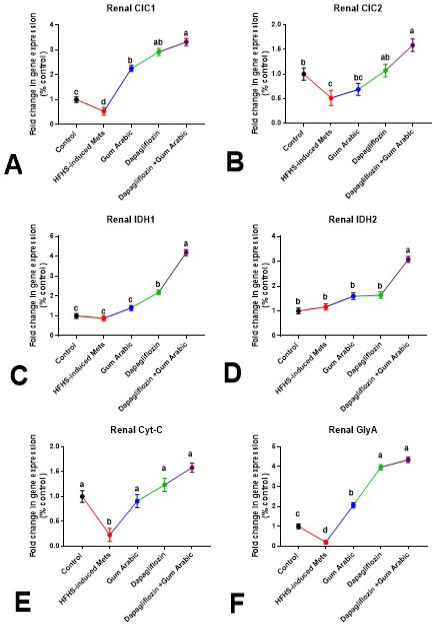
Renal changes in gene expression (A-F). A. Renal CIC1, B. Renal CIC2, C. Renal IDH1, D. Renal IDH2, E. Renal Cytc and F. Renal GlyA. Relative expression was calculated as a percentage of the control value. Data are presented as means±SEM. Means bearing different superscripts were significantly different at P<0.05.


