Advances in Animal and Veterinary Sciences
Research Article

Spatial Analysis of Rabies Cases in Dogs in Bali Province, Indonesia
Ratna Vitta Ekowati1, Etih Sudarnika2*, Trioso Purnawarman2
¹Graduate School, Veterinary Public Health Study Program, IPB University; Indonesia; ²Department of Animal Infectious Diseases and Veterinary Public Health, Faculty of Veterinary Medicine, IPB University, Indonesia.
Abstract | Bali Province contracted rabies at the end of 2008. The first case of rabies in the province occurred in Badung District and then spread to other areas until all areas of the province were infected with rabies.. The study aimed to analyze the pattern of spatial occurrence of rabies cases in dogs in Bali Province. Data of dog rabies cases was obtained from the surveillance conducted by the Denpasar Veterinary Disease Investigation Center in 2012-2018. The data analysis was carried out using autocorrelation of Morans Index. The results show that rabies cases in a region affected adjacent areas. Spatial correlation produces hotspot (high case areas surrounded by low case areas), coldspots (low case areas surrounded by high case areas), quadrant I (high case areas surrounded by high case areas), and quadrant III (low case area surrounded by low case areas) areas. Nine sub-districts are recurrent hotspot areas and the potential of the areas as source of rabies spread need to be observed. Otherwise, 19 sub-districts are known to be recurrent coldspot areas that have a high potential as area susceptible to rabies transmission. Areas included in quadrant I are dominated by sub-districts in Karangasem, Buleleng, Jembrana, and Bangli District. Sub-district included quadrant III increased subdistricts in number over the past two years, showing progress in implementing control and prevention of rabies in dogs in Bali Province.
Keywords | Spatial analysis, Rabies, Hotspot, Coldspot, Bali
Received | June 18, 2019; Accepted | July 28, 2019; Published | December 20, 2019
*Correspondence | Etih Sudarnika, Department of Animal Infectious Diseases and Veterinary Public Health, Faculty of Veterinary Medicine, IPB University; Indonesia; Email: etih.sudarnika@gmail.com
Citation | Ekowati RV, Sudarnika E, Purnawarman T (2020). Spatial analysis of rabies cases in dogs in bali province, indonesia. Adv. Anim. Vet. Sci. 8(1): 32-40.
DOI | http://dx.doi.org/10.17582/journal.aavs/2020/8.1.32.40
ISSN (Online) | 2307-8316; ISSN (Print) | 2309-3331
Copyright © 2020 Ekowati et al. This is an open access article distributed under the Creative Commons Attribution License, which permits unrestricted use, distribution, and reproduction in any medium, provided the original work is properly cited.
Introduction
Rabies is an acute animal disease which can communicate from animal to human. When it has shown clinical symptoms, rabies cases always end in death, both in animals or humans (Ditkeswan, 2015). The World Health Organization (WHO) stated that 99% of rabies cases caused by dog bites (WHO, 2018a). WHO also estimated that deaths caused by rabies reach 59,000 cases each year globally with 95% of cases occurring in Africa and Asia (WHO, 2018b).
Historically, Bali Province of Indonesia is free from rabies, until the first confirmed case of both animals and humans rabies in Semenanjung Bukit, Badung District (Putra, 2011). Semenanjung Bukit is relatively a localized area so we have a good hope that rabies can be controlled rapidly. Although the coordination method of control and eradication of rabies in Bali have been applied using cross-sectoral approach, bothin the level of local and center, the spread of the disease cannot be controlled. It resulted the spread of disease in all areas of Bali Province in June 2010 (Putra et al., 2009). Then, it resulted people’s anxiety and threat to the development of Bali tourism (Putra, 2011). Moreover, the data from the Ministry of Health showed that 54.76% of cases of rabies animal bites in Indonesia in 2011-2017 occurred in Bali Province (Kemenkes, 2018).
Rabies is a disease that can be controlled by the surveillance system through continuous disease detection to identify the infection of rabies in animals (Ditkeswan, 2015). Spatial analysis is one of methods for analyzing the surveillance data that is useful for identifying and analyzing patterns of disease in an area. The analysis produced a visual aid in the form of a disease map that will provide information on spatial correlation and disease risk mapping. The disease map is expected to be used as baseline for the surveillance system to determine indicators of early vigilance as well as measures to overcome and control rabies in Bali Province. Research on the pattern of the incidence of rabies based on spatial correlation is still very limited in Indonesia, so this study was conducted with the aim of analyzing the pattern of spatial occurrence of rabies cases in dogs in Bali Province based on the value of spatial correlation.
Materials and Method
Data Sources
The study uses secondary data obtained from the Directorate of Animal Health, Directorate General of Livestock and Animal Health Services, Ministry of Agriculture. The form of the data is positive rabies cases in 2012-2018. Positive cases of rabies in dogs were determined using fluorescent antibody test (FAT) which conducted by the Denpasar Veterinary Disease Investigation Center. There is no need for ethical approval because the data analyzed in the present study is secondary data and obtained from the Denpasar Veterinary Investigation Center. The Denpasar Veterinary Investigation Center is an institution under the Ministry of Agriculture that has the mandate to conduct animal disease surveillance.
Data Analysis
The data needed in this analysis are rabies case data and official maps of Bali Province. Firstly, we merged the administrative data map of Bali Province with data on rabies cases. The merging process produces spatial rabies data that provides integrated information, namely the administrative location of the region in the form of vectors and attribute data in the form of the number of rabies cases in each area. Secondly, we made a weighting matrix using the Queen Contiguity method to determine the close relationship between sub-districts based on the number of nearby locations owned by each sub-district. Lastly, we calculated the Moran Index value from rabies case data in Bali Province using the following equation (Lee and Wong, 2001):
I =
with I is the Moran Index value, N is the number of locations, Xi is the value at location i, Xj is the value at location j, is the average number of variables, and Wij is the element of weighting between regions i and j.
The results of spatial autocorrelation calculations in the form of Moran index values range from -1 to 1. The positive Moran index value (I>0) indicates positive spatial autocorrelation, which means that adjacent locations have similar values and tend to group. The negative Moran index value (I <0) indicates negative spatial autocorrelation, which means that nearby areas have different values and tend to spread, while the Moran Index value of 0 (zero) indicates there is no autocorrelation, meaning the pattern of random locations, not grouped (Lee and Wong, 2001).
The results of the statistical calculation of the Moran Index were then interpreted in the Moran Scatterplot to determine the pattern of spatial occurrences of rabies cases. The Morans Scatterplot was presented based on the Z-score data of a location on one axis and the neighboring Z-score value on the other axis to determine the spatial correlation of each observed area (Zhukov, 2010). The Z-score equation is as follows:
with the value of Z (I) is the value of the Morans Index test statistic, I is the Moran Index value, while E (I) is the expectation value of the Moran Index, and VAR (I) is the Variance of the Morans Index. The next step is to use GeoDa 1.8 software, to divide the area under study into the appropriate quadrant so we can classify each sub-district as hotspots and coldspots, and sub-districts included in quadrant I and quadrant III.
Result
The Denpasar Veterinary Disease Investigation Center has tested 8 773 samples in the period of 2012-2018 from dogs suspected of rabies, of which 1 121 (13%) were positive for rabies. The proportion of positive cases of rabies in dogs in 2012-2018 in Bali Province is presented in Table 1.
Table 1: The proportion of positive cases of rabies in dogs in 2012-2018 in Bali Province
| Year | Number of samples | Positive | Proportion Positive |
| 2012 | 745 | 121 | 16.2% |
| 2013 | 949 | 40 | 4.2% |
| 2014 | 1272 | 130 | 10.2% |
|
2015 |
3160 | 387 | 16.7% |
| 2016 | 1428 | 205 | 14.3% |
| 2017 | 999 | 89 | 8.9% |
| 2018 | 889 | 147 | 16.5% |
| Total | 8773 | 1121 | 13% |
In Table 1, it can be seen that the proportion of rabies cases shows a downward trend in circumstances, which were previously in 2015 of 16.7%, decreased to 14.3% in 2016 and 8.9% in 2017. However, in 2018, there was an increase in the proportion of cases by 16.5%. (Table 1 has been attached).
The test results showed that 1119 samples were positive for rabies; 86 % of the samples came from dogs that had not been vaccinated, while 14% of the samples comes from dogs that had been vaccinated. The proportion of rabies positive dogs that have not been vaccinated with those that have been vaccinated in Bali Province in 2012-2018 is presented in Table 2.
Table 2: The proportion of rabies positive dogs that have not been vaccinated with those vaccinated in Bali Province in 2012-2018
| Year | Samples positive | Vaccinated | Not Vaccinated |
| 2012 | 121 | 18 | 103 |
| 2013 | 40 | 6 | 34 |
| 2014 | 130 | 21 | 109 |
| 2015 | 387 | 48 | 339 |
| 2016 | 205 | 21 | 184 |
| 2017 | 89 | 11 | 78 |
| 2018 | 147 | 27 | 120 |
| Total | 1119 | 152 (14%) | 967 (86%) |
The presence of dogs that are positive for rabies even though they have been vaccinated needs further analysis. Some of the factors that cause the failure of vaccination are influenced by the quality of vaccines, cold chain management that is not following the standard operational procedures, dogs are already in the incubation period, and the individual response is dogs (Putra, 2011). Septiani et al. (2018) reported that in 2017 in the Province of Bali there were positive cases of rabies in dogs that had been vaccinated. Based on the observation, the samples came from dogs that had just been vaccinated between 1-2 weeks before sampling so that the dogs were probably in their rabies incubation periode. There were also several samples from dogs that had been vaccinated two years earlier and had not been vaccinated so that the dog did not have enough antibody titers to prevent infection during rabies transmission.
Table 3: The proportion of positive cases of rabies in dogs in districts/cities in 2012-2018 in Bali Province
| District/cities | Specimen | Positive | Proportion positive |
| Badung | 1310 | 52 | 4% |
| Bangli | 1565 | 221 | 14% |
| Buleleng | 942 | 196 | 21% |
| Denpasar | 694 | 12 | 2% |
| Gianyar | 820 | 117 | 14% |
| Jembrana | 992 | 158 | 16% |
| Karangasem | 1133 | 241 | 21% |
| Klungkung | 723 | 45 | 6% |
| Tabanan | 594 | 77 | 13% |
Most positive samples of rabies came from Karangasem District, which was 21%, while the lowest came from Denpasar City as much as 2%. The proportion of positive cases of rabies in dogs in districts/cities in Bali Province in 2012-2018 is presented in Table 3.
The top ten sub-district with highest rabies cases in 2012-2018 came from Bangli, Karangasem, Jembrana, Buleleng and Tabanan districts. Districts with the highest percentage of rabies cases over seven years (2012-2018) can be seen in Table 4.
Table 4: Sub-district with the highest percentage of rabies cases in 2012-2018 in Bali Province
| Ranking | Sub-district | Positive cases | Percentage (%) |
| 1 | Kintamani | 109 | 9.74 |
| 2 | Negara | 49 | 4.38 |
| 3 | Susut | 46 | 4.11 |
| 4 | Kubu | 46 | 4.11 |
| 5 | Abang | 42 | 3.75 |
| 6 | Mendoyo | 39 | 3.49 |
| 7 | Melaya | 38 | 3.40 |
| 8 | Sawan | 34 | 3.04 |
| 9 | Karangasem | 34 | 3.04 |
| 10 | Tabanan | 28 | 2.50 |
Table 5: Z value and rabies cases pattern in 2012-2018 in Bali Province
| Year | Z value | Moran Index | P value | The pattern of rabies cases |
| 2012 | 3.97 | 0.287 | 0.005 | cluster |
| 2013 | 1.61 | 0.118 | 0.056 | random |
| 2014 | 1.35 | 0.092 | 0.097 | random |
| 2015 | 0.88 | 0.046 | 0.187 | random |
| 2016 | 1.80 | 0.132 | 0.045 | cluster |
| 2017 | 1.92 | 0.151 | 0.040 | cluster |
|
2018 2012-2018 |
2.48 2.84 |
0.183 0.210 |
0.017 0.008 |
cluster cluster |
The risk of spreading rabies to free areas is quite high. The presence of rabies in an area will threaten the surrounding
area, especially areas that are directly adjacent to infected areas so that the situation of the rabies-free regions is not safe if the surrounding area is infected with rabies. In this study, the sub-districts with the highest percentage of rabies cases in Table 4 cannot be directly categorized as hotspot areas because their assessment is not in high rabies cases in the sub-district but also see the existence of rabies cases in other neighboring sub-districts. Therefore, to find out the pattern of spatial events, it is necessary to analyze spatial correlation. The results of the spatial analysis of the model of rabies cases in dogs in the Province of Bali in this study are presented in Table 5.
The results of spatial analysis of hotspot, coldspot, quadrant I and quadrant III regions are presented in thematic maps which are visualizations of Moran’s scatterplot. Sub-district included in quadrant I are denoted by red, sub-district including quadrant II (coldspot area) are denoted in yellow, sub-district including quadrant III are denoted in green, and sub-district including quadrant IV (hotspot area) are denoted pink. The map of the spread of rabies cases per year in Bali Province in 2012-2018 based on the Moran Scatterplot can be seen in Figure 1, while the map of the range of rabies cases with 7 years of observation (2012-2018) in the Province of Bali based on the Moran Scatterplot can be seen in Figure 2.
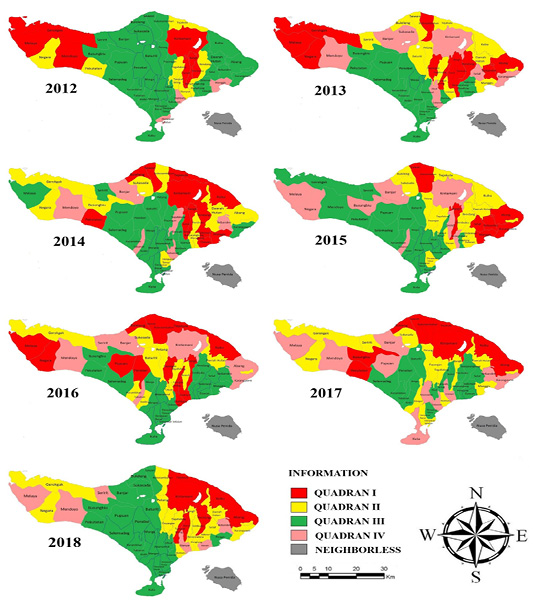
It was shown in Figure 1 that there is an increase and decrease in the number of areas that become hotspot and coldspot area for rabies cases each year. The lowest number of hotspot in 2012 was 4 sub-district, while the highest number occurred in 2017, namely 9 sub-districts. Some sub-districts are known to be more than one hotspot, namely Mendoyo and Melaya Sub-districts of Jembrana District, Tabanan Sub-district of Tabanan District, Sukawati and Gianyar Sub-districts of Gianyar District, Kintamani Sub-district of Bangli District, Karangasem and Bebandem Sub-districts of Karangasem District, and Banjar Sub-district of Buleleng District.
The coldspot areas with the lowest quantity of coldspot areas occurred in 2012, namely 8 sub-districts. while the highest number occurred in 2015 and 2018, which were 15 sub-districts respectively. Some sub-districts are also known to be recurrent coldspot areas, namely Negara Sub-district of Jembrana District, Baturiti Sub-district of Tabanan District; Petang Sub-district of Badung District; Gianyar, Tegallalang, and, Payangan Sub-districts of Gianyar District; Banjarangkang and Klungkung Sub-district of Klungkung District; Tembuku Sub-district of Bangli District; Rendang, Manggis, Kubu, and Sidemen Sub-districts, and forest areas in Gunung Agung of Karangasem District; Tejakula, Buleleng, Gerokgak, Sukasada, and Kubutambahan Sub-districts of Buleleng District.
Observation of regions included in quadrant I, the highest number occurred in 2013, 2014 and 2016, namely 14 sub-districts, while the lowest number was 7 sub-districts that occurred in 2018. The results of quadrant III analysis showed the number of regions included in quadrant III in the year 2012 was 32 sub-districts, declining in 2013 to 19 sub-districts, experiencing an increase in 2014 to 22 sub-districts, then decreasing again in 2015 and 2016 in 21 sub-districts and 18 sub-districts respectively, then in 2017 and 2018 it increased again into 23 districts each. The 7-year observation also shows that rabies hotspot areas occur in sub-districts included in the districts of Buleleng, Jembrana, and Tabanan. Areas that become cold spots occur in sub-districts in the Klungkung, Buleleng, Gianyar, Badung and Karangasem Districts, as well as forest areas in Gunung Agung, Karangasem District. Areas included in quadrant I were 16 sub-districts originating from Jembrana, Bangli, Karangasem and Buleleng Districts. Otherwise, regions included in quadrant III were spread across 23 sub-districts from Jembrana, Tabanan, Badung, Gianyar, Klungkung, Karangasem, Buleleng Districts and Denpasar City.

The results of the spatial pattern analysis of the spread of rabies cases per year as shown in Figure 1 compared to 7 years of observation as shown in Figure 2 shows that there
Table 6: The sub-districts that are hotspots, coldspots, and subdistricts included in quadrant I and quadrant III of rabies cases in dogs in 2012-2018 in Bali Province
| Year | Quadrant | Sub-district |
| 2012 |
Quadrant I (high-high) |
Melaya, Negara, Mendoyo, Susut, Bangli, Tembuku, Kintamani, Gerokgak |
|
Quadrant II (coldspot) |
Pekutatan, Gianyar, Tampak Siring, Tegallalang, Banjarangkang, Rendang, Tejakula | |
|
Quadrant III (low-low) |
Selemadeg, Kerambitan, Tabanan, Kediri, Marga, Baturiti, Penebel, Pupuan, Kuta, Mengwi, Abiansemal, Petang, Sukawati, Ubud, Payangan, Klungkung, Dawan, Sidemen, Karangasem, Abang, Bebandem, Selat, Kubu, Seririt, Busungbiu, Banjar, Sukasada, Buleleng, Sawan, Kubutambahan, Denpasar Timur, Denpasar Barat, forest area in Gunung Agung | |
|
Quadrant IV (hotspot) |
Blahbatu, Manggis, Denpasar Selatan | |
| 2013 |
Quadrant I (high-high) |
Melaya, Negara, Tampak Siring, Ubud, Payangan, Bajarangkang, Susut, Bangli, Tembuku, Rendang, Abang, Bebanden, Gerokgak, Kubutambahan |
|
Quadrant II (coldspot) |
Baturiti, Petang, Gianyar, Tegallalang, Manggis, Kubu, Seririt, Buleleng, Sawan, Tejakula, forest area in Gunung Agung | |
|
Quadrant III (low-low) |
Pekutatan, Selemadeg, Kerambitan, Tabanan, Kediri, Marga, Penebel, Pupuan, Kuta, Mengwi, Abiansemal, Blahbatu, Klungkung, Dawan, Sidemen, Busungbiu, Denpasar Selatan, Denpasar Timur, Denpasar Barat | |
|
Quadrant IV (hotspot) |
Mendoyo, Sukawati, Kintamani, Karangasem, Selat, Banjar, Sukasada | |
| 2014 |
Quadrant I (high-high) |
Pekutatan, Klungkung, Dawan, Susut, Bangli, Tembuku, Kintamani, Rendang, Sidemen, Manggis, Kubu, Buleleng, Sawan, Tejakula |
|
Quadrant II (coldspot) |
Negara, Banjarangkang, Abang, Selat, Gerokgak, Busungbiu, Sukasada, Kubutambahan, forest area in Gunung Agung | |
|
Quadrant III (low-low) |
Melaya, Selemadeg, Kerambitan, Kediri, Marga, Baturiti, Penebel, Pupuan, Kuta, Mengwi, Abiansemal, Petang, Blahbatu, Gianyar, Tampak Siring, Ubud, Payangan, Karangasem, Seririt, Denpasar Barat, Denpasar Timur, Denpasar Selatan | |
|
Quadrant IV (hotspot) |
Mendoyo, Tabanan, Sukawati, Tegallalang, Bebandem, Banjar | |
| 2015 |
Quadrant I (high-high) |
Bangli, Manggis, Karangasem, Abang, Bebandem, Selat, Sawan, Kubutambahan |
|
Quadrant II (coldspot) |
Petang, Gianyar, Tegallalang, Payangan, Klungkung, Dawan, Tembuku, Rendang, Sidemen, Kubu, Gerokgak, Sukasada, Buleleng, Tejakula, forest area in Gunung Agung | |
|
Quadrant III (low-low) |
Mendoyo, Pekutatan, Selemadeg, Kerambitan, Kediri, Marga, Baturiti, Penebel, Pupuan, Kuta, Mengwi, Abiansemal, Sukawati, Blahbatu, Tampak Siring, Ubud, Klungkung, Seririt, Denpasar Selatan, Denpasar Timur, Denpasar Barat | |
|
Quadrant IV (hotspot) |
Melaya, Negara, Tabanan, Banjarangkang, Susut, Kintamani, Busungbiu, Banjar | |
| 2016 |
Quadrant I (high-high) |
Melaya, Negara, Penebel, Pupuan, Blahbatu, Gianyar, Tampak Siring, Payangan, Bangli, Kubu, Buleleng, Sawan, Kubutambahan, Tejakula |
|
Quadrant II (coldspot) |
Kerambitan, Kediri, Baturiti, Petang, Ubud, Tegallalang, Banjarangkang, Susut, Rendang, Sukasada, forest area in Gunung Agung | |
|
Quadrant III (low-low) |
Pekutatan, Selemadeg, Marga, Kuta, Mengwi, Abiansemal, Sukawati, Klungkung, Dawan, Tembuku, Sidemen, Manggis, Bebandem, Selat, Busungbiu, Denpasar Selatan, Denpasar Timur, Denpasar Barat | |
|
Quadrant IV (hotspot) |
Mendoyo, Tabanan, Kintamani, Karangasem, Abang, Seririt, Banjar | |
| 2017 |
Quadrant I (high-high) |
Pekutatan, Kintamani, Abang, Bebandem, Kubu, Busungbiu, Buleleng, Sawan, Kubutambahan, Tejakula |
|
Quadrant II (coldspot) |
Negara, Mengwi, Petang, Tegallalang, Payangan, Manggis, Gerokgak, Sukasada, Denpasar Selatan, forest area in Gunug Agung | |
|
Quadrant III (low-low) |
Selemadeg, Kerambitan, Tabanan, Kediri, Marga, Baturiti, Penebel, Mengwi, Blahbatu, Tampak Siring, Ubud, Banjarangkang, Klungkung, Dawan, Susut, Bangli, Tembuku, Rendang, Sidemen, Selat, Seririt, Denpasar Barat, Denpasar Timur | |
|
Quadrant IV (hotspot) |
Melaya, Mendoyo, Pupuan, Kuta, Abiansemal, Sukawati, Gianyar, Karangasem, Banjar | |
| 2018 |
Quadrant I (high-high) |
Tampak Siring, Susut, Kintamani, Rendang, Abang, Kubu, Tejakula |
|
Quadrant II (coldspot) |
Negara, Petang, Blahbatu, Tegallalang, Payangan, Banjarangkang, Klungkng, Bangli, Tembuku, Sidemen, Karangasem, Selat, Gerokgak, Kubutambahan, forest area in Gunung Agung | |
|
Quadrant III (low-low) |
Pekutatan, Selemadeg, Kerambitan, Tabanan, Kediri, Marga, Baturiti, Penebel, Pupuan, Kuta, Mengwi, Abiansemal, Sukawati, Ubud, Manggis, Busungbiu, Banjar, Sukasada, Buleleng, Sawan, Denpasar Selatan, Denpasar Barat, Denpasar Timur | |
|
Quadrant IV (hotspot) |
Melaya, Mendoyo, Gianyar, Dawan, Bebandem, Seririt | |
| 2012-2018 |
Quadrant I (high-high) |
Melaya, Negara, Gianyar, Susut, Bangli, Tembuku, Kintamani, Rendang, Manggis, Karangasem, Abang, Bebandem, Kubu, Bulelelng, Kubutambahan, Tejakula |
|
Quadrant II (coldspot) |
Petang, Tegallalang, Payangan, Banjarangkang, Sidemen, Gerokgak, Sukasada, forest area in Gunung Agung | |
|
Quadrant III (low-low) |
Pekutatan, Selemadeg, Kerambitan, Kediri, Marga, Baturiti, Penebel, Pupuan, Kuta, Mengwi, Abiansemal, Sukawati, Blahbatu, Tampak Siring, Ubud, Klungkung, Dawan, Sidemen, Selat, Busungbiu, Denpasar Selatan, Denpasar Barat, Denpasar Timur | |
|
Quadrant IV (hotspot) |
Mendoyo, Tabanan, Seririt, Banjar, Sawan |
is one area, namely Sawan Sub-district of Buleleng District which has never been a hotspot in representation as a hotspot in seven-year period at a time. The sub-districts which are hotspot, coldspot, and those included in quadrant I and quadrant III cases of rabies in dogs in Bali Province based on thematic maps in Figures 1 and 2 are presented in Table 6.
Discussion
The province of Bali consists of 8 districts (Tabanan, Badung, Gianyar, Karangasem, Klungkung, Bangli, Jembrana, and Buleleng DIstricts) and 1 city (Denpasar City). From 9 districts/cities, the areas are divided into 57 sub-districts (BPS, 2018). Bali people live side by side with dogs. The estimated ratio of dogs to humans is 1: 5.8, where the wild or non-proprietary dog population is only about 5%, but 90% of the proprietary dogs are kept released. The status of rabies endemic area of Bali Province, in addition to the dense population of dogs, and the culture of people raising dogs makes higher chances of healthy dogs and humans bitten by dogs that are infected with rabies compared to other regions (Putra, 2011; Suartha et al., 2014). As a world tourist destination, rabies has a real social impact and has a significant economic impact in Bali Province. A previous study in the province in 2008-2011 concluded the economic losses due to rabies were estimated at 336.5 billion rupiahs (Batan et al., 2014). Mass vaccination is the main strategy for eradicating rabies, in conjunction with other strategies, such as surveillance, traffic control, population management, and health education based on cultural conditions in Indonesia through a specific approach for each region (Ditkeswan, 2015).
According to the result of the present study in annual observations (from 2102 to 2018) and seven-years observation, there are also spatial correlations which indicates that adjacent locations have similar values, which means that rabies cases in an area affect other nearby regions. The pattern of distribution of cases formed observation each year is in 2012 with clustered pattern, while in 2013-2015 it was random patterned, then in 2016-2018, and in the analysis of 7 years at the same time, cluster patterns returned (Table 5). The model of the incidence of infectious diseases such as rabies is basically clustered pattern. This is following the behavioral study of dogs in the Province of Bali, that dogs that are known to be the perpetrators of the cycle of rabies transmission (maintenance host) have a wide range of range. The maximum range of dog cruising is 4 km (Putra, 2011; Jatikusumah et al., 2014) so that local transmission has the potential to occur. Ward’s (2014) study, which examined the spatial patterns of rabies cases in humans and animals in the Dutch East Indies (the Dutch colony which became modern Indonesia after World War II), stated that rabies cases spatially form clustered patterns, which are on the west and east coasts of Sumatra, West Java, Batavia District, East Java, West Nusa Tenggara and Borneo.
Some of the factors that cause the occurrence of disease are random pattern, among others, because each sub-district has a diverse area and a short observation time for diseases. In 7 year observations (2012-2018), there was a cluster pattern, namely the grouping of disease occurance. The length observation time can provide a clearer picture of the model of disease events. It agreed the research conducted by Simanjuntak (2013), which states that the pattern of Avian Influenza (AI) disease in DI Yogyakarta Province is random, but with longer observation times it can be seen that there are cluster patterns that indicate the grouping of AI occurrences. Another factor that causes randomly patterned rabies is the transportation or transfer of dogs to other areas triggered by the elimination or extermination of dogs. Batan et al. (2014) reported that the high incidence of rabies in various regions showed human intervention by moving dogs from rabies-infected areas to rabies-free areas. It also agrees with Ma et al. (2017) that on the spatial pattern of food and mouth diseases (FMD) in China, that during the 2010-2016 study period, the distribution of FMD showed a random pattern caused by animal transportation between provinces. The change in the pattern of events from random patterns to groups with the addition of research time will make the implementation of control and control measures for rabies more focused on vulnerable or risky areas.
The spatial correlation of rabies cases results in sub-districts becoming hotspot and coldspot areas, and those included in quadrant I and quadrant III. Subdistricts included in the hotspot category have the potential to be areas that transmit rabies. The existence of sub-districts which are recurring hotspots needs to be observed because they have greater potential as a source of spread of rabies to the surrounding sub-districts. Subdistricts included in the coldspot category have the potential to be susceptible to rabies transmission, therefore it needs to be observed especially in sub-districts which tend to be recurrent coldspot areas.
Another important thing is the observation of areas included in quadrant I and quadrant III. The mapping results show that the highest spread of rabies is found in sub-districts included in quadrant I, while sub-districts with a low spread of rabies are in quadrant III. The results of quadrant III analysis that need attention are a large number of sub-districts included in quadrant III. It is related to the control and control measures for rabies that have been carried out. The results of observations per year indicate a decrease and increase in the number of sub-districts in quadrant III. However, in the last two years, 2017 and 2018, there has been an increase in the number of sub-districts in quadrant III. This shows progress in implementing rabies eradication measures. This situation is in line with the research conducted by Pujana et al. (2018) which states that in 2017 and 2018 in the Province of Bali there has been a decline in rabies transmitting animal bites, a decrease in the percentage of the use of Anti Rabies Vaccines (VAR), and a decrease in the number of villages infected with rabies. This is related to the implementation of the Procedure for Integrated Bite Cases (TAKGIT), which is a form of rabies surveillance in the form of guidance for field officers in responding and following up on suspected animal bite cases of rabies which are coordinated across sectors between human health workers and animal health (Nurhayati et al., 2018). TAKGIT implementation provides benefits in the form of the sensitivity of the surveillance system both in the public health sector and animal health, where bite cases that are handled in an integrated manner are the starting point for further investigation of incidents to find rabies cases that have not been reported (Pujana et al., 2018). However, the proportion of cases presented in Table 1 shows an increase in positive cases of rabies in 2018. Ditkeswan and FAO ECTAD (2019) stated that an increase in cases in 2018 was due to several obstacles in the implementation of vaccinations. The obstacles are the late availability logistics of immunization, the daily target of mass vaccination that is not optimal so that vaccination coverage is lacking, and post-vaccination surveys are not carried out. Therefore, monitoring of vaccination progress is unknown, and the implementation of emergency vaccinations as a quick response to cases is not carried out optimally.
The results of the spatial pattern analysis of the spread of rabies cases per year compared with observations for seven years at the same time indicate that there are not many differences in sub-districts included in the category of hotspots and cold spots. However, there are exciting things on the thematic map with observations for seven years at a time (Figure 2), Sawan Sub-district of Buleleng District which has never been a hotspot area on view per year as a hotspot area at seven years at a time. It occurred due to additional time or more extended observations that give a different picture of the pattern of the disease. In a more expansive view, the presence of rabies cases in an area influenced by the surrounding sub-districts. Another exciting thing is that the forest area in Gunung Agung is consistently a cold spot area, both on yearly observations and seven years of view. In Gunung Agung, no cases of rabies because the forest is not the habitat of free-living dogs. Otherwise, the villages around Gunung Agung included in Karangasem District are known to have high cases of rabies (Abriansyah et al. 2017). Therefore, the forest area of Gunung Agung surrounded by coldspot areas.
The success of rabies eradication measured in this study is not only based on the number of cases in a region but also looks at spatial correlation, namely the situation of rabies in a sub-district with other sub-districts bordering or neighboring. The expected location is that sub-districts included in quadrant III are increasing in number, so that sub-districts included in quadrant I and hotspot and coldspot areas will decrease in number, are localized in some regions or even no longer exist. It showed that the effort to control and control rabies was successfully carried out by eliminating the disease from the Bali Province.
Changes in an area to a hotspot or coldspot or included in quadrant III and I are influenced by several factors, including the dog population, the presence of rabies cases in a sub-district and the adjacent sub-district, vaccination status, the total area, and the dog traffic. Putra (2011) reported that mass vaccinations carried out since 2010 have been shown to reduce attack rates on rabies in Bali Province. Dibia et al. (2015) also said that dogs that were not vaccinated were at risk of being infected with disease 19.13 times greater than dogs vaccinated against rabies. Community acceptance of the existence of dogs, availability of food sources, and dog fertility rates are estimated to make the dog population continue to increase (Jatikusumah et al., 2014). Uncontrolled dog populations will increase the risk of transmission and spread of rabies. As much as 82% of the dog population in the Province of Bali is dogs owned but kept free-living. The dogs will roam freely, allowing direct contact with other dogs, even with rabies-infected dogs (Batan and Suatha, 2016). In managing the dog population, the government carried out surgical sterilization of male and female dogs, the construction of dog shelters for unowned dogs. Other efforts are controlling dog access to food sources by conducting trash management, tied the dogs or kept the dogs in cages, so the dogs are not allowed to roam outside the house, as well as selective elimination with due regard to the principles of animal welfare (Ditkeswan 2015).
Analysis of hotspot and coldspot areas shows the risk of spread of rabies to other bordering regions and to determine the threat of an area to the presence of rabies in other adjacent territories, while analysis on quadrant I and quadrant III shows trends in disease based on spatial patterns and success of control measures and rabies prevention. Information obtained regarding the model of spatial events in spatial cases is expected to be useful to determine the control and prevention of rabies in Bali Province based on spatial patterns.
Conclusions
The present study concluded that rabies cases in dogs in the Province of Bali during the 2012-2018 observations showed a spatial correlation in the pattern of disease events which means rabies cases in an area affecting other adjacent areas. Spatial correlation produces sub-districts included in quadrant I, quadrant II (coldspot), quadrant III, and quadrant IV (hotspot). Areas that are recurrent hotspots need to be watched out for because they have greater potential as a source of spread of rabies to surrounding sub-districts. Districts that are recurrent coldspot areas need to be observed because they have greater potential as areas that are susceptible to rabies transmission. Districts included in quadrant I are sub-districts with the highest spread of rabies. Areas in Quadrant III are sub-districts with low spread of rabies, increasing in number in the last two years, showing progress in implementing control and prevention of rabies in dogs in the Province of Bali.
Acknowledgment
This research was support by scholarship from Badan Penyuluhan dan Pengembangan Sumber Daya Manusia (BPPSDMP), Ministry of Agriculture, Indonesia.
Conflict Of Interest
There is no conflict of interest in this review to declare.
Authors Contribution
The research was designed jointly by Ratna Vitta Ekowati, Etih Sudarnika, and Trioso Purnawarman. Ratna Vitta Ekowati conducted the research. All the authors have read and approved the final manuscript.
REFERENCES


