Advances in Animal and Veterinary Sciences
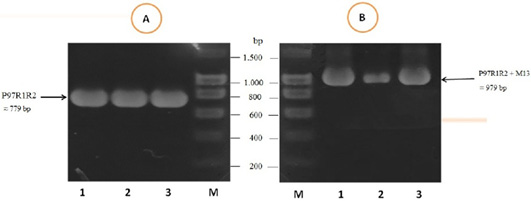
PCR amplification of the peptide coding sequence of P97R1R2 gene fragment (accession no. AY512905) from genomic DNA isolated from fresh lung tissue samples of pigs suffering from PEP in Thua Thien Hue province, Vietnam. M: DNA size marker (100-1500 bp, Bio Basic); Lanes 1-3 (A): PCR products of P97R1R2 gene fragment; Lanes 1-3 (B): PCR products of M13 primer pairs of pGEM®-T Easy vector.
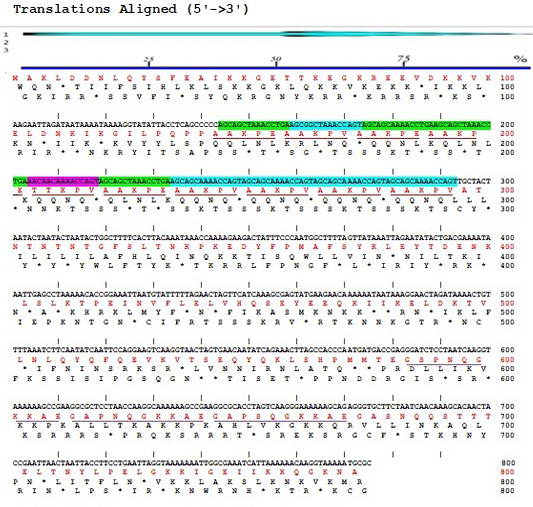
Sequences of nucleotide (5’→3’) and amino acids of P97R1R2 gene fragment from M. hyopneumoniae isolated from pigs in Thua Thien Hue province, Vietnam.
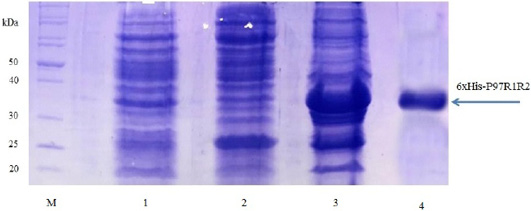
SDS-PAGE analysis of the expression of recombinant P97R1R2 protein in E. coli BL21(DE3) cells on LB medium. M: Protein weight marker (10-200 kDa, Bio Basic); Lane 1: transformed E. coli BL21(DE3) cells without IPTG induction; Lanes 2 and 3: Soluble (in supernatant) and inclusion body protein of transformed E. coli BL21(DE3) cells induced with 0.8 mM IPTG when OD600 of the cultures reached 0.8 and incubated at 37oC, 150 rpm for 8 h post-induction, respectively; Lane 4: purified fusion protein.
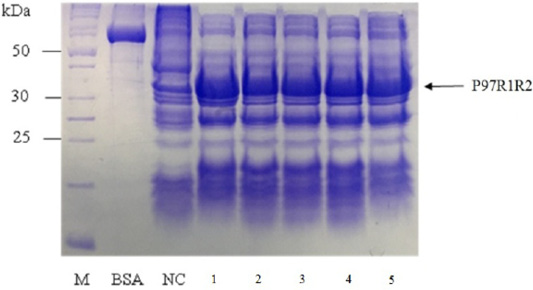
SDS-PAGE analysis of effect of cultivation temperatures on the expression of recombinant P97R1R2 protein in E. coli BL21(DE3) on LB medium. M: protein weight marker (10-200 kDa, Bio Basic); BSA: albumin 750 µg/ml; NC: transformed E. coli BL21(DE3) cells without IPTG induction; Lanes 1, 2, 3, 4 and 5: inclusion body protein of transformed E. coli BL21(DE3) cells induced with 0.8 mM IPTG when OD600 of the cultures reached 0.8 and incubated at different temperatures of 16, 20, 25, 30 and 37 oC, respectively for 8 h post-induction.
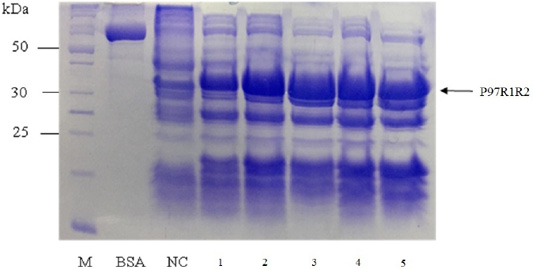
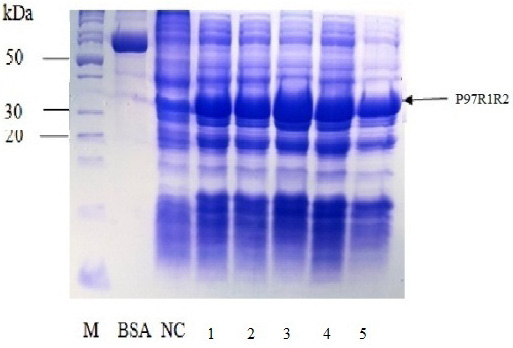
SDS-PAGE analysis of effect of culture media on expression of recombinant P97R1R2 protein in E. coli BL21(DE3). M: protein weight marker (10-200 kDa, Bio Basic); BSA: albumin 750 µg/ml; NC: transformed E. coli BL21(DE3) cells on LB medium without IPTG induction; Lanes 1, 2, 3, 4 and 5: inclusion body protein of transformed E. coli BL21(DE3) cells on different culture media of YJ, TB, LB, HSG and modified M9ZB, respectively, induced with 0.8 mM IPTG when OD600 of the cultures reached 0.8 and incubated at 25oC for 8 h post-induction.
SDS-PAGE analysis of effect of different final IPTG concentrations on expression of recombinant P97R1R2 protein in E. coli BL21(DE3) on YJ medium. M: protein weight marker (10-200 kDa, Bio Basic); BSA: albumin 750 µg/ml; NC: transformed E. coli BL21(DE3) cells without IPTG induction; Lanes 1, 2, 3, 4 and 5: transformed E. coli BL21(DE3) cells induced with IPTG at final concentrations of 0.2, 0.4, 0.6, 0.8 and 1 mM, respectively, when OD600 of the cultures reached 0.8 and incubated at 25oC for 8 h post-induction.
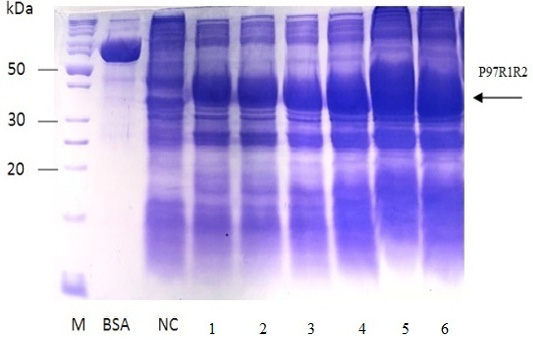
SDS-PAGE analysis of effect of post-induction IPTG induction time on expression of recombinant P97R1R2 protein in E. coli BL21(DE3) on YJ medium. M: protein weight marker (10-200 kDa, Bio Basic); BSA: albumin 750 µg/ml; NC: transformed E. coli BL21(DE3) cells without IPTG induction; Lanes 1, 2, 3, 4, 5 and 6: inclusion body protein of transformed E. coli BL21(DE3) cells induced with 0.6 mM IPTG when OD600 of the cultures reached 0.4, 0,6, 0.8, 1.0, 1.5 and 2.0, respectively, and incubated at 25oC for 8 h.
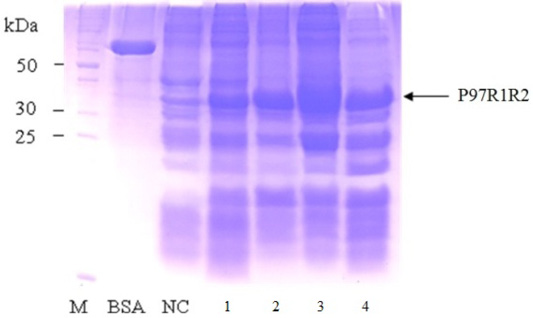
SDS-PAGE analysis of effect of different post-inducction incubation time on expression of recombinant P97R1R2 protein in E. coli BL21(DE3) on YJ medium. M: protein weight marker (10-200 kDa, Bio Basic); BSA: albumin 750 µg/ml; NC: transformed E. coli BL21(DE3) cells without IPTG induction; Lanes 1, 2, 3 and 4: inclusion body protein of transformed E. coli BL21(DE3) cells induced with 0.6 mM IPTG when OD600 of the cultures reached 1.5, and incubated at 25oC for 2, 4, 6 and 8 h, respectively.


