Advances in Animal and Veterinary Sciences
Research Article

Clinicopathological Studies and New Markers for Trypanosoma evansi in Experimentally Infected Rats
Asmaa Abdallah Darwish1, Enas Abd El-Aziz Tahoun2, Gehad Rashad Donia1, Rasha Salah Mohammed1*
1Department of Animal and Poultry Health, Animal and Poultry Production Division, DRC, Cairo, Egypt; 2Pathology Departments, Faculty of Veterinary medicine, University of Sadat City, Egypt.
Abstract | Traypanosoma evansi is a dangerous protozoal disease that usually results in severe economic losses in the camel producing countries. So, this study aimed to monitor some clinicopathological and pathological alterations associated with T. evansi infection experimentally and assess the diagnostic and prognostic value of matrix metalloproteinase-2 (MMP-2), matrix metalloproteinase-9 (MMP-9), creatine kinase (CK), cardiac troponin I and cholinesterase in T. evansi infection. In this study, 24 albino rats (12 males and 12 females) were used; samples were collected from 4 rats before the experiment (0 day) and from the rest rats at 7th, 14th, 21st, 28th, 35th day after intraperitoneal injection of T. evansi. Hematological results demonstrated a significant (P<0.05) microcytic hypochromic anemia accompanied with a significant (P<0.05) leukocytosis and lymphocytopenia in T. evansi infected rats until 21st day, then the anemia converted to macrocytic hypochromic anemia. The biochemical results showed a significant (P<0.05) hypoproteinemia, hypoalbuminemia, decreased A/G ratio, hyperglobulinemia, hypoglycemia, hyperlipidemia, hypertriglyceridemia, hypochlestrolemia and a significant (P<0.05) increase in the renal function tests, MMP-2, MMP-9, CK, cardiac troponine I and cholinesterase activities. The main lesions in the examined organ sections were necrosis, edema, fibrosis, inflammatory cell infiltrations and loss of structure. On the other hand, MMP-2, MMP-9, CK, cardiac troponin I and cholinesterase had good values of sensitivity, specificity and correlated efficiently with the other clinicopathological changes in T. evansi infected rats. Conclusion: this study showed clearly that T. evansi infection associated with several clinicopathological as well as histopathological changes and suggested MMP-2, MMP-9, CK, cardiac troponin I and cholinesterase as new markers for T. evansi infection.
Keywords | Trypanosoma evansi, Rats, Clinicopathological changes, New markers, Histopathological changes.
Received | June 03, 2019; Accepted | August 20, 2019; Published | October 25, 2019
*Correspondence | Rasha Salah Mohammed, Department of Animal and Poultry Health, Animal and Poultry Production Division, DRC, Cairo, Egypt; Email: rashanono2008@yahoo.com
Citation | Darwish AA, Tahoun EAE, Donia GR, Mohammed RS (2019). Clinicopathological studies and new markers for trypanosoma evansi in experimentally infected rats. Adv. Anim. Vet. Sci. 7(11): 977-985.
DOI | http://dx.doi.org/10.17582/journal.aavs/2019/7.11.977.985
ISSN (Online) | 2307-8316; ISSN (Print) | 2309-3331
Copyright © 2019 Mohammed et al. This is an open access article distributed under the Creative Commons Attribution License, which permits unrestricted use, distribution, and reproduction in any medium, provided the original work is properly cited.
Introduction
Trypanosomiasis is a serious parasitic infection that affects both human and animals, as it has several species. Among their most dangerous species T. evansi, which is a constraint in the expansion of camel breeding in the producing countries (Ahmadi-hamedani, et al., 2014; Zewdu, et al., 2018). Whereas, it affects widely different dromedaries resulting in severe economic losses related to the disease symptoms such as decreased milk production and body gain, abortion, severe damages in vital organs such as kidney, heart, brain and finally death. The cost of the treatment and prophylaxis must be taken in consideration as another losses for camel trypanosomiasis. (Abd El-Baky and Salem 2011; Ahmadi-hamedani et al., 2014).
The nature of camel trypanosomiasis as a silent disease as well as its late detection, maximize its effect and decrease its recovery rates. So, there is a need to improve our information about hematological, biochemical and pathological changes related to the disease and find new diagnostic and prognostic tools for trypanosomasis (Abd El-Baky and Salem 2011).
Matrix metalloproteinase-2 (MMP-2) and matrix metalloproteinase-9 (MMP-9) are Zn containing, Ca dependent proteases, belong to a large group of endopeptidases known as matrix metalloproteinases (MMPs). MMPs are a part of the host innate immunity produced under the effect of the pro-inflammatory cytokines. They are degenerative molecules mainly responsible for extracellular matrix protein destruction, processing of some bioactive molecules, splitting of cell surface receptors, releasing of apoptotic ligand and inhibition of chemokines. In addition, they may take apart in cellular proliferation, differentiation, adhesion, angiogenesis, apoptosis and inflammatory immune response regulation against different infections. They are secreted by different immune cells in a latent form (zymogen) then activated by different mechanisms at site of their work, and controlled by the tissue inhibitors of matrix metalloproteinases (Bruschi and Pinto 2013; Ortega et al., 2017). Regardless of their critical role in the mechanism of some physiological processes, they are closely related to the pathogenesis of different human diseases as chronic kidney diseases, blood vessels diseases, different types of cancer and were suggested to be a useful marker for T. cruzi and T. brucei infection in human (Gutierrez et al., 2008; Bautista-López et al., 2013; Bruschi and Pinto 2013). Surprisingly, there is too little information about MMPs significance in the animal diseases.
Hence, this work aimed to study some clinicopathological and pathological alterations of T. evansi infection experimentally to exclude the effect of any other factors on these changes rather than T. evansi infection. It also assessed the diagnostic and prognostic value of MMP-2, MMP-9, creatine kinase (CK), cardiac troponin I and cholinesterase in T. evansi infection and their correlations with the other clinicalpathological changes associated with the disease.
Material and methods
All ethical points regarding the laboratory animal’s treatment were followed in this research. This study was carried on 24 rats (Rattus norvegicus, 12 males and 12 females) with average body weight 200 gm. They were let to adapt to the surrounding conditions before the start of the experiment.
First, 4 rats (control group (CG), 2 males and 2 females): were anaesthetized with diethyl ether and blood samples were collected by heart puncture before the start of the experiment (0 day).
The rest 20 rats (T. evansi infected rats (IR), 10 males and 10 females): were injected intraperitoneally with 0.5 ml serum of naturally infected camels with T. evansi (the diagnosis was done by giemsa-stain blood smears). Samples (blood by heart puncture and tissue from heart, kidneys, brain) were collected from IR at 7th, 14th, 21st, 28th and 35th day post infection (4 rats every time, 2 males and 2 females) after anesthesia with diethyl ether.
Blood samples: were divided in two sets of tubes: one contained EDTA was sent immediately for estimation of hematological parameters and the other one was plain (without anticoagulant) and clean whereby blood was let to coagulate and centrifugated at 3000 r.p.m. for 20 minutes at 37 ºC then serum was separated in a clean Eppendorf tube for estimation of the rest biochemical parameters.
Hematological parameters were evaluated according to Feldman, et al. (2000), the biochemical analysis were estimated spectrophotometrically by using commercial kits supplied by Biodiagnostic company®, serum MMP-2 and MMP-9 concentrations were measured by ELISA kits supplied by Cloud- Clone Corp company®, CK were determined using ELISA kits supplied by MyBiosource company®, serum cardiac troponin I levels were evaluated by ELISA kits supplied by RayBiotech company®, serum cholinesterase was detected spectrophotometrically by kits supplied by Biomed, Egypt company® (all manual instructions were carefully followed).
The hisotpathological examination was done by sectioning the tissue samples into thin small cuts then fixing them rapidly using 10% neutral buffered formalin solution. Later, these sections were prepared and stained using (H & E) stain according to Bancroft and Gamble (2002).
Statistical Analysis
Measured parameters were presented as mean ± standard deviation (SD). SPSS program version 20 was used to compare between means of different statistical parameters (one-way ANOVA test), estimate the post hoc differences between means (a multiple comparison Tukey`s HSD test) and calculate the correlations between the selected parameters (Pearson’s simple correlation method). A difference was considerable significant at P< 0.05.
Graphed prism version 5 program was used to calculate the cut off points, sensitivity, specificity and likelihood ratio (LR) for the measured MMP-2, MMP-9, CK, cardiac troponin I and cholinesterase between IR and CG. The positive predictive value (PPV), negative predictive value (NPV), accuracy rate and percentage of increase of them were calculated according the next formulas:


Results
The Clinicopathological Results
Table (1) revealed that the IR suffered from a microcytic hypochromic anemia till the 21st day represented by a significant (P<0.05) decrease in red blood cell count (RBCs), hemoglobin concentration (Hb), packed cell volume (PCV), mean corpuscular volume (MCV), mean corpuscular hemoglobin (MCH), mean corpuscular hemoglobin concentration (MCHC). Interestingly, PCV and MCV start to increase and the type of anemia changed to macrocytic hypochromic anemia. On the other hand, the leukogram of IR characterized with a significant leukocytosis symbolized by neutrophilia, monocytosis and eosinophilia, but the lymphocytes significantly decreased in IR. Regarding the biochemical changes, the data of Table (2) illustrated a significant (P<0.05) drop in serum concentrations of total protein, albumin, albumin/globulin ratio (A/G ratio), glucose, cholesterol, HDL-cholesterol, LDL-cholesterol in IR. On the contrary, the serum concentrations of globulin, total lipids, triglycerides, phospholipids, kidney function tests (blood urea nitrogen (BUN), creatinine (Cr)), MMP-2, MMP-9, CK, cardiac troponin I and cholinesterase significantly (P<0.05) enhanced in IR.
Table 1: The effect of the T. evansi infection on the hematological parameters of IR. Values mean ±SD.
| Parameters | 0 day |
7th day |
14th day |
21st day |
28th day |
35th day |
|
RBCs (×106/μl) |
4.68±0.70 | 2.90±0.06 | 2.32±0.11 | 1.60±0.13 | 1.23±0.04 | 1.21±0.01* |
| Hb (g/dl) | 12.87±3.07 | 5.83±0.33 | 4.33±0.60 | 2.88±0.39 | 2.20±0.24 | 2.00±0.01* |
| PCV (%) | 26.00±5.51 | 13.78±0.56 | 10.70±0.65 | 10.95±0.70 | 11.15±0.70 | 12.00±0.01* |
| MCV (fl) | 56.33±4.30 | 47.60±0.95 | 46.05±1.02 | 68.43±2.26 | 90.59± 2.80 | 99.17±0.01* |
| MCH (pg) | 27.27±2.65 | 20.11±0.72 | 18.56±1.70 | 17.89±1.01 | 17.85±1.37 | 16.53±0.01* |
| MCHC (%) | 48.44±3.13 | 42.27±0.77 | 40.28±3.22 | 26.17±1.93 | 19.69±1.05 | 16.67±0.01* |
|
TLC(×103/μl) |
4.65±0.77 | 9.02±1.01 | 10.51±1.38 | 11.48±1.28 | 12.35±0.96 | 14.54±0.01* |
|
Neutrophils(×103/μl) |
2.20±0.43 | 6.65±0.60 | 8.05±0.93 | 8.93±0.81 | 9.73±0.50 | 11.20±0.01* |
|
Lymphocytes(×103/μl) |
1.63±0.15 | 1.45±0.13 | 1.32±0.10 | 1.15±0.13 | 0.96±0.11 | 0.90±0.01* |
|
Monocytes(×103/μl) |
0.45±0.13 | 0.48±0.17 | 0.62±0.16 | 0.66±0.14 | 0.73±0.09 | 0.92±0.01* |
|
Eosinophils(×103/μl) |
0.38±0.17 | 0.44±0.19 | 0.62±0.21 | 0.75±0.23 | 0.93±0.28 |
1.22±0.01* |
The effect of the T. evansi infection considered significant when P <0.05 and indicated by (*).
Table 2: The effect of T. evansi infection on some biochemical parameters of IR. Values mean ±SD.
| Parameters | 0 day |
7th day |
14th day |
21st day |
28th day |
35th day |
| Total protein(g/dl) | 7.18±0.33 | 6.89±0.34 | 6.62±0.32 | 6..37±0.26 | 6.17±0.32 | 6.13±0.07* |
| Albumin (g/dl) | 4.40±0.32 | 3.48±0.22 | 2.27±0.12 | 1.89±0.09 | 1.45±0.09 | 1.15±0.07* |
| Globulin (g/dl) | 2.78±0.10 | 3.42±0.16 | 4.35±0.21 | 4.48±0.18 | 4.72±0.23 | 4.98±0.14* |
| A\G | 1.59±0.13 | 1.02±0.05 | 0.52±0.01 | 0.42±0.01 | 0.31±0.01 | 0.23±0.02* |
| Total lipids (mg/dl) | 427.25±13.60 | 458.50±17.00 | 482.75±19.62 | 589.50±20.68 | 502.25±18.83 | 504.00±2.83* |
| Triglycerides (mg/dl) | 140.00±5.89 | 158.50±7.19 | 180.75±6.80 | 189.50±8.85 | 201.75±13.18 | 208.00±0.01* |
| Phospholipids (mg/dl) | 149.25±3.77 | 175.00±13.90 | 191.00±18.51 | 200.00±16.33 | 215.25±13.60 | 217.00±1.41* |
| Cholesterol (mg/dl) | 138.50±9.57 | 125.00±3.83 | 111.00±6.00 | 100.00±5.16 | 85.01±8.25 | 81.00±1.41* |
| HDL-cholesterol(mg/dl) | 42.50±1.91 | 37.00±2.58 | 33.00±2.58 | 30.25±1.63 | 25.00±2.58 | 24.00±0.01* |
| LDL-cholesterol (mg/dl) | 95.50±4.43 | 88.00±1.63 | 78.00±3.65 | 70.00±3.65 | 60.00±5.88 | 57.00±1.41* |
| Glucose (mg/dl) | 119.08±3.82 | 99.38±7.98 | 87.42±7.38 | 70.18±4.67 | 62.96±5.01 | 57.66±1.36* |
| BUN(mg/dl) | 19.78±1.21 | 28.43±0.52 | 32.35±0.35 | 34.66±0.21 | 36.64±0.15 | 38.67±0.31* |
| Cr(mg/dl) | 0.59±0.09 | 1.24±0.01 | 1.42±0.02 | 1.51±0.06 | 1.61±0.07 | 1.68±0.01* |
| MMP-2(ng/ml) | 17.01±1.68 | 23.05±2.55 | 35.40±4.29 | 49.22±4.45 | 59.55±6.45 | 66.30±0.01* |
| MMP-9(ng/ml) | 18.49±1.54 | 25.22±2.36 | 34.28±3.77 | 56.98±4.45 | 61.72±7.23 | 72.40±0.01* |
| CK (Pg/ml) | 49.49±9.16 | 60.60±4.14 | 70.30±9.64 | 81.57±8.45 | 102.98±10.15 | 118.30±0.01* |
| Cardiac troponin I (ng/ml) | 0.02±0.01 | 0.28±0.06 | 0.32±0.06 | 0.36±0.06 | 0.40±0.06 | 0.48±0.01* |
| Cholinesterase (u/l) | 292.25±37.57 | 392.25±37.57 | 515.75±66.58 | 615.25±46.73 | 762.75±124.78 |
1184.00±0.01* |
The effect of T. evansi infection considered significant when P <0.05 and indicated by (*).
Table 3: The cut off points, sensitivity, specificity, LR, PPV, NPV and accuracy rate of MMP-2, MMP-9, CK, cardiac troponin I, cholinesterase in the current experiment.
| Statistical parameters | MMP-2 | MMP-9 | CK | Cardiac troponin I | Cholinesterase |
| Cut off points | 18.20(ng/ml) | 19.77(ng/ml) | 56.55 ( Pg/ml) | 0.015 ( ng/ml) | 324.50 (u/l) |
| Sensitivity | 100% | 100% | 100% | 100% | 100% |
| Specificity | 75% | 75% | 75% | 50% | 75% |
| LR | 4 | 4 | 4 | 2 | 4 |
| PPV | 95.24% | 95.24% | 95.24% | 90.91% | 95.24% |
| NPV | 100% | 100% | 100% | 100% | 100% |
| Accuracy rate | 95.83% | 95.83% | 95.83% | 95.83% |
95.83% |
Table 4: The percentage of increase of MMP-2, MMP-9, CK, cardiac troponin I and cholinesterase in IR compared with CG.
| Parameters |
7th day |
14th day |
21th day |
24th day |
35th day |
| MMP-2 | 35.51% | 108.51% | 189.36% | 250.09% | 289.77% |
| MMP-9 | 36.40% | 85.40% | 208.17% | 233.80% | 291.77% |
| CK |
22.46 % |
42. 21% | 64.82% | 106.67% | 139.04% |
| Cardiac troponin I | 130% | 150% | 170% | 190% | 230% |
| Cholinesterase | 34.22% | 76.48% | 110.52% | 160.99% |
305.13% |
Table 5: The correlation between duration, MMP-2, MMP-9, CK, cardiac troponin I, cholinesterase and the estimated clinicopathological parameters in IR (Pearson’s correlation test, value=r-value).
| Parameters | Duration | MMP-2 | MMP-9 | CK | Cardiac troponin I | Cholinesterase |
| Duration | 1 | 0.974* | 0.963* | 0.939* | 0.861* | 0.924* |
| RBCs | -0.912* | -0.862* | -0.853* | -0.811* | -0.777* | -0.750* |
| Hb | -0.835* | -0.768 | -0.756* | -0.677* | -0.878* | -0.664* |
| PCV | -0.682* | -0.604* | -0.585* | -0.506* | -0.815* | -0.495* |
| MCV | 0.833* | 0.851* | 0.857* | 0.863* | 0.540* | 0.837* |
| MCH | -0.782* | -0.680* | -0.668* | -0.587* | -0.812* | -0.598* |
| MCHC | -0.963* | -0.936 | -0.944* | -0.875* | -0.767* | -0.847* |
| TLC | 0.905* | 0.909* | 0.892* | 0.911* | 0.986* | 0.872* |
| Neutrophils | 0.913* | 0.896* | 0.879* | 0.880* | 0.985* | 0.839* |
| Lymphocytes | -0.919* | -0.839* | -0.834* | -0.760* | -0.713* | -0.769* |
| Monocytes | 0.750* | 0.821* | 0.827* | 0.883* | 0.750* | 0.850* |
| Eosinophils | 0.804* | 0.884* | 0.871* | 0.933* | 0.803* | 0.902* |
| Total protein | -0.809* | -0.693* | -0.693* | -0.580* | -0.582* | -0.603* |
| Albumin | -0.958* | -0.916* | -0.897* | -0.838* | -0.864* | -0.819* |
| Globulin | 0.931* | 0.938* | 0.909* | 0.889* | 0.926* | 0.847* |
| A\G | -0.919* | -0.882* | -0.859* | -0.806* | -0.909* | -0.774* |
| Total lipids | 0.828* | 0.718* | 0.704* | 0.652* | 0.681* | 0.635* |
| Triglycerides | 0.936* | 0.859* | 0.843* | 0.795* | 0.780* | 0.775* |
| Phospholipids | 0.862* | 0.755* | 0.741* | 0.679* | 0.668* | 0.663* |
| Cholesterol | -0.963* | -0.900* | -0.885* | -0.829* | -0.777* | -0.809* |
| HDL-cholesterol | -0.947* | -0.879* | -0.859* | -0.811* | -0.777* | -0.785* |
| LDL-cholesterol | -0.964* | -0.905* | -0.891* | -0.832* | -0.771* | -0.815* |
| Glucose | -0.956* | -0.898* | -0.895* | -0.816* | -0.811* | -0.794* |
| BUN | 0.924* | 0.897* | 0.882* | 0.853* | 0.933* | 0.819* |
| Cr | 0.881* | 0.816* | 0.798* | 0.772* | 0.920* |
0.732* |
Statistical significance of correlations * was recorded when P < 0.5.
Concerning the assessment of MMP-2, MMP-9, CK, cardiac troponin I and cholinesterase importance in the diagnosis and prognosis of T. evansi infection, Table (3) elucidated that they are sensitive markers for T. evansi but MMP-2, MMP-9, CK and cholinesterase had higher values of specificity, LR and PPV than cardiac troponin I. On the other hand, Table (4) clarified that the percentage of increase for them was fluctuating, whereas cardiac troponin I scored the highest percentage of increase at the 7th and 14th day. Otherwise, MMP-9 recorded the better percentage of increase at the 21st day and MMP-2 was the best at 28th day. On the other side, by the end of the study cholinesterase percentage of increase was the superior.
Table (5) illustrated a significant (P<0.05) negative correlation between the experiment duration and RBCs, Hb, PCV, MCH, MCHC, lymphocytes, total protein, albumin, A\G, glucose, cholesterol, HDL-cholesterol, LDL-cholesterol as well as a significant (P<0.05) positive correlation between the experiment duration and MCV, TLC, neutrophils, monocytes, esinophils, globulin, total lipids, triglycerides, phospholipids, kidney function tests, CK, cardiac troponin I, MMP-2, MMP-9 and cholinesterase in IR. A significant (P<0.05) negative correlation was also recorded between serum MMP-2, MMP-9, CK, cardiac troponin I, cholinesterase and RBCs, Hb, PCV, MCH, MCHC, lymphocytes, total protein, albumin, A\G, glucose, cholesterol, HDL-cholesterol, LDL-cholesterol as well as a significant (P<0.05) positive correlation between MMP-2, MMP-9, CK, cardiac troponin I, cholinesterase and MCV, TLC, neutrophils, monocytes, esinophils, globulin, total lipids, triglycerides, phospholipids and kidney function tests in IR.
Histopathological Results
The heart lesions in male and female rats, began at the 7th day with single cell necrosis of heart muscle, mild congestion, inflammatory cell infiltration and edema in the interstitial tissue. These lesions became marked and increased in severity toward 35th day. The fibrosis around blood vesseles began to appear from 21st day and increased in severity toward 35th days. A marked necrosis of heart muscles and loss of striation were seen at 28th, 35th day (Figure 1). While, the microscopic examination of the male and female rats kid
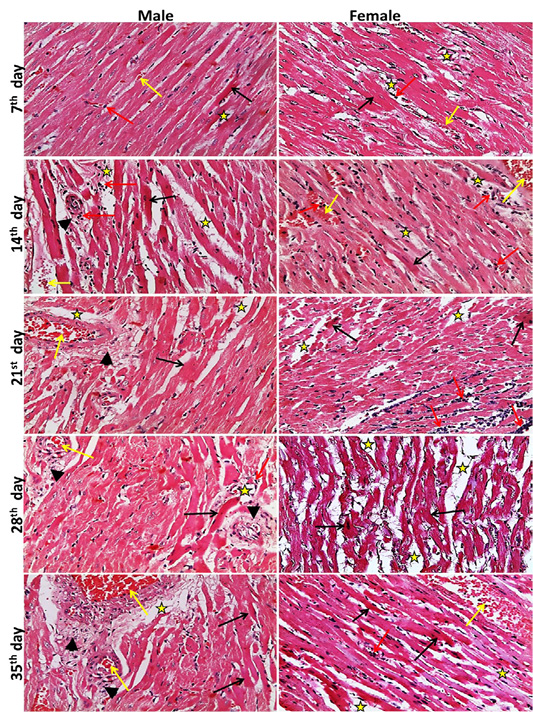
Figure 1: Representative photomicrographs of heart sections of male and female rats at 7th, 14th, 21st, 28th, 35th days (H&E stain X20) {Interstitial edema (stars), congestion (yellow arrows), inflammatory cell infiltration (red arrows), necrotic muscles (black arrows), perivascular fibrosis s (head arrows).
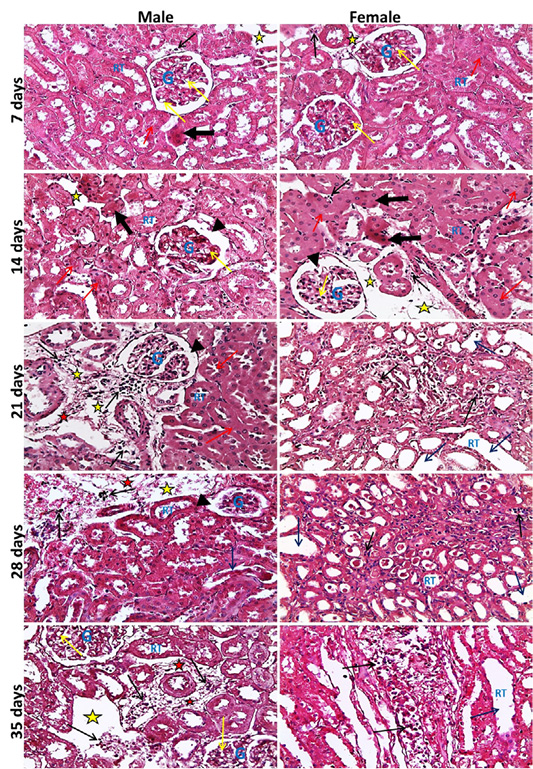
neys showed at the 7th day, normal size of glomerular tuft with mild vacuolar degeneration of glomerular cells, cloudy swelling and necrosis of sporadic renal tubules especially in male, mild edema and inflammatory cell infiltration were also seen. Then at the 14th day, atrophied glomerular tuft and widening of Bowman′s space beside the same lesions found at 7th day but increased in severity. Inflammatory cell infiltration became marked from the 21st day and increase in severity toward the 35th day. While, dilatation of collecting and medullary tubules with hyaline casts and fibrosis around glomeruli and blood vesseles began to appear from 21st day and increased in severity toward the 35th day (Figure 2). The histopathological examination of the male and female rat brains started at the 7th day, with necrosis of some neurons, features of neuronal degeneration as neuronophagia, perineural satellitosis and perivascular cuffing (infiltration of mononuclear cells in the Virchow-Robin space around congested blood vessels). Necrotic neurons with perineural edema increased in number from the 14th day toward the 35th day. Demyelination of most parts of brain tissues began to appear from 21st day and increase in severity toward the 35th day (Figure 3).
Figure 2: Representative photomicrographs of kidney sections of male and female rats at 7th, 14th, 21st, 28th, 35th days (H&E stain X20) {glomeruli (G), renal tubules (RT), widening of Bowmans space (head arrows), vacuolar degeneration of glomerular cells (yellow arrows), necrotic renal tubules (thick black arrows), cloudy swelling of renal tubules (red arrows), dilated renal tubules (blue arrows), inflammatory cell infiltration (black thin arrows), edema of interstitial tissue (yellow stars), fibrosis (red stars).

Figure 3: Representative photomicrographs of brain sections of male and female rats at 7th, 14th, 21st, 28th, 35th days (H&E stain X20) {Perivascular cuffing (yellow arrows), neuronophagia (red arrows), perineural satellitosis (black arrows), necrotic neurons with perineural edema (blue arrows), demyelination (stars).
Discussion
T. evansi is a constraint hinders the camel breeding expansions in the producing countries, as it usually attacks different camel species resulting in high morbidities, mortalities and several economic losses. No doubt that, the awareness with the clinicopathological and pathological changes associated with disease may help in developing more effective therapeutic interventions and avoiding a part of its economic losses (Abd El-Baky and Salem 2011; Ahmadi-hamedani et al., 2014).
Concerning the hematological changes, the data of the current study agreed with the common believe that T. evansi infection usually accompanied with anemia described morphologically as microcytic hypochromic and etiologically as hemolytic (Abd El-Baky and Salem 2011; Ahmadi-hamedani et al., 2014). Several factors may be involved in this hemolytic anemia mechanism such as the mechanical destruction of RBCs due to the presence of the parasite in the blood stream and its metabolic activities and the release of trypanosomal sialidase enzyme that hydrolyzes the sialic of RBCs membrane causing its destruction as well as inhibits the erythrogensis (Ahmadi-hamedani et al., 2014). In addition the innate immunity of the host itself participates in the exacerbation of this anemia by different ways, as the oxidative damage of RBCs and the hemodilution due to removal of large amounts of RBCs in spleen and haemal lymph nodes by the activated mononuclear phagocytic system (Zewdu et al., 2018). The transformation of anemia from microcytic hypochromic to macrocytic hypochromic anemia after the 21st day and the positive correlation between the experiment duration and MCV referred to the bone marrow response by releasing the reticulocytes and immature RBCs in the circulating blood (Zewdu et al., 2018). On the other hand, the outstanding neutrophilia, monocytosis, esinophilia and subsequent leukocytosis in IR in the present study, are mainly linked to the immune response of the host against the parasite and the activation of the monolocular phagocytic system. Besides that, the stress connected with the diseases may play a role in this neutrophilic leukocytosis by stimulating the endogenous corticosteroid production (Ahmadi-hamedani et al., 2014). Otherwise, the esinophilia is a characteristic feature of different parasitic infection because of the hypersensitivity reaction (Abd El-Baky and Salem, 2011).
In connection with biochemical changes, the detected hypoprotenemia and decreased A/G here, is due to the prominent hypoalbuminemia recorded along the course of the disease, which fundamentally resulted from the anorexia and hypoxic hepatic injury related to the T. evansi infection (Ahmadi-hamedani et al., 2014; Mbaya et al., 2014). Moreover, the acute phase response and the oxidative stress accompanied the disease are closely involved in this hypoalbuminemia whereas, the albumin is a strong negative acute phase reactant and antioxidant (Ahmadi-hamedani et al., 2014; Hussain et al., 2016). Meanwhile, the obtained hyperglobulinemia was assigned to the immune response against T. evansi either innate or humeral and the dependent positive acute phase proteins and antibodies production (El-Bahr and El-Deeb 2016).
Regarding the described hyperlipidemia in IR, the serum total lipid concentrations mostly affected by the serum levels of triglycerides and cholesterol. In the present experiment the triglyceride increase, override the cholesterol decrease but not very much. The observed hypertriglyceridemia is closely attached with the inhibition of lipoprotein lipase enzyme by the pro-inflammatory cytokines, which secreted as a part of the acute phase response of the host against the T. evansi infection. This enzyme is the major promoter of triglycerides clearance from the blood by enhancement their storage in the adipose tissue and its inhibition leading to the accumulation of triglycerides in the blood (Ngure et al., 2008). On contrast, the above mentioned hypocholesterlemia was attributed to the oxidative stress associated with T. evansi infection and the nature of HDL-cholesterol as anti-oxidant. Furthermore, T. evansi consumes the host lipids and cholesterol because of its inability to create the required cholesterol and lipids for her growth and multiplication (Adamu et al., 2008; Eze et al., 2015). In the same way, a marked hypoglycemia was demonstrated in our results whereas T. evansi uses most of the host blood glucose to cover her energy needs. Moreover, it hinders glucose liberation from the gluconeogenic pathways of the host (Mbaya et al., 2014).
The raised kidney function tests, serum CK and cardiac troponin I concentrations in the current experiment indicated sever renal, skeletal and cardiac muscles damages. Additionally, the energy imbalance usually connected with the parasite activity, stimulates CK secretion to restore energy balance (Tejero et al., 2010; Abd El-Baky and Salem 2011; El-Deeb and El moslemany 2015; Rio and Bm, 2017). Consistently, the serum MMP-2 and MMP-9 which pave the way for the inflammatory cell migration, parasite movement, tissue damage and disrupt the blood brain barrier integrity (Bautista-López et al., 2013; Bruschi and Pinto, 2013), showed an enhanced activity in this research as well as in human trypanosomasis before (Gutierrez, et al., 2008; Bruschi and Pinto 2013). While, the elevated cholinesterase levels in this work and in a former rabbit experimental T. evansi infection, are closely attached to their indirect pro-inflammatory role by attenuation the anti-inflammatory action of the Acetyl choline (Costa et al., 2012). Logically, the positive correlation between the kidney function tests, CK, cardiac troponin I, MMP-2, MMP-9, cholinesterase and the experiment duration cleared that the kidney, heart, skeletal muscles and brain degeneration in T. evansi infection is progressive and continuous.
The above-mentioned clinicopathological changes were supported by the histopahtological findings in this work, which showed mainly necrosis, edema, inflammatory cell infiltrations, fibrosis and loss of structure in the examined organs. These lesions started mild at the 7th day, increased gradually until reaching the maximum severity by the end of the experiment. Generally, these pathological changes were attributed to the toxins liberated by the parasites, presence of the parasite in the blood vessels and impairment of the blood supply to the affected organs, hypoglycemia related the disease and the migration of the parasite and the subordinate tissue damages. Besides that, the deposition of the immune complexes and the inflammatory cells impair the organs functions and structures (Bal et al., 2012). Similar alterations were noticed before in experimental T. evansi infection in Swiss albino mice and experimental T. vivax infection in calves (Bal et al., 2012; Tesfu 2014).
In connection with MMP-2, MMP-9, CK, cardiac troponin I and cholinesterase value in the diagnosis and prognosis of T. evansi infection, the data of Table (3) and Table (4) proposed their usage as sensitive markers for the disease. Moreover, their correlation with the other estimated parameters in IR (Table 5), stated them as good indicators for other clinicopathological changes linked to T. evansi infection and reflected their participation in the pathogenesis of the disease. It worth to mention that, the specificity, LR and PPV values gave the priority for MMP-2, MMP-9, CK, cholinesterase on cardiac troponin I, while the fluctuating percentages of increase didn`t suggested any preference for one marker on the others.
Finally, this study cleared that T. evansi infection associated with several clinicopathological as well as histopathological changes correlated with the infection duration, which may be taken in consideration to reduce the side effects of the disease and develop the supportive treatment for the diseased animals. MMP-2, MMP-9, CK, cardiac troponin I and cholinestrase may be new markers for T. evansi infection but for more thoroughness, they should be studied in naturally infected dromedaries.
Conflict of interest
The authors have no conflict of interest.
Authors contribution
All authors contributed equally.
References


