Advances in Animal and Veterinary Sciences
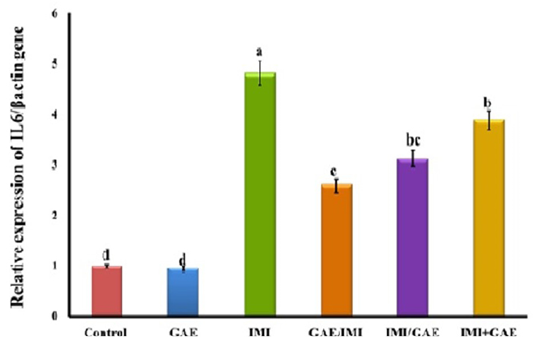
Graphical presentation of real-time quantitative PCR analysis of the expression of IL6 gene in liver of IMI-intoxicated rats following treatment with GAE. Means of columns carrying different superscript letters are significantly different at P≤ 0.05. B actin gene was used as internal reference (housekeeping gene).
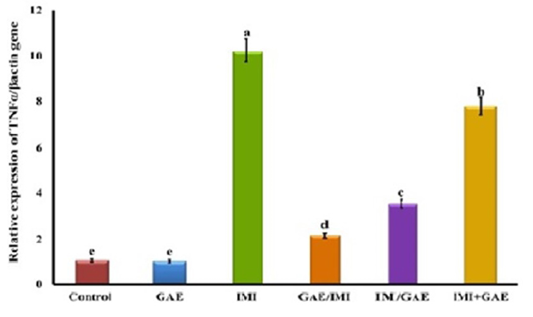
Graphical presentation of real-time quantitative PCR analysis of the expression of TNF-α gene in liver of IMI-intoxicated rats following treatment with ginger. Means of columns carrying different superscript letters are significantly different at P≤ 0.05. B actin gene was used as internal reference (housekeeping gene).
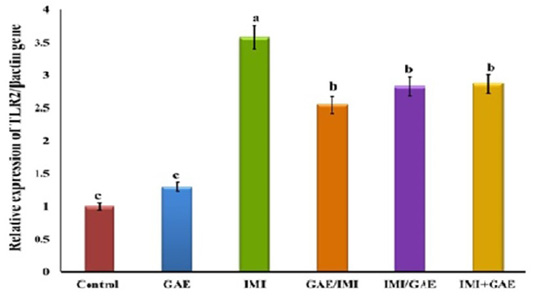
Graphical presentation of real-time quantitative PCR analysis of the expression of TLR2 gene in liver of IMI-intoxicated rats following treatment with GAE. Means of columns carrying different superscript letters are significantly different at P≤ 0.05. B actin gene was used as internal reference (housekeeping gene).
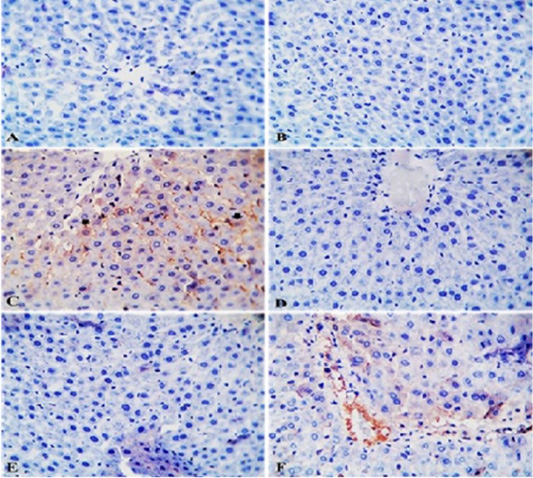
Photomicrograph of TNFα-IHC stained liver sections from control (A) and GAE groups (B) showing normal hepatic parenchyma with negative immunostaining. Liver sections from IMI group showing mild to moderate immunopositive staining of TNFα as brownish granular materials in hepatocytoplasm (arrows) (C). Liver sections from GAE/IMI (D) and IMI/GAE (E) groups showing negative immunostaining of TNFα. Liver sections from IMI+GAE group showing mild immunostaining of TNFα in a few hepatic cytoplasms. X400. H and E.
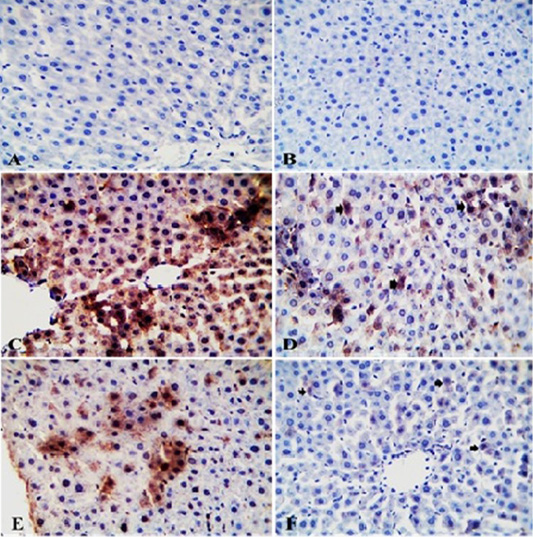
Photomicrograph of TLR2-IHC stained liver sections from control (A) and GAE groups (B) showing normal hepatic parenchyma with negative immunostaining. Liver sections from IMI group showing intense immunopositive staining as brownish granular materials in hepatocytoplasm (C). Liver sections from GAE/IMI (D) and IMI/GAE (E) groups showing mild to moderate immunopositive staining in individual hepatocytes (arrows). Liver sections from IMI+GAE group showing slight immunopositive cytoplasmic granules staining in a few hepatocytes (arrows) (F). X400. H and E.
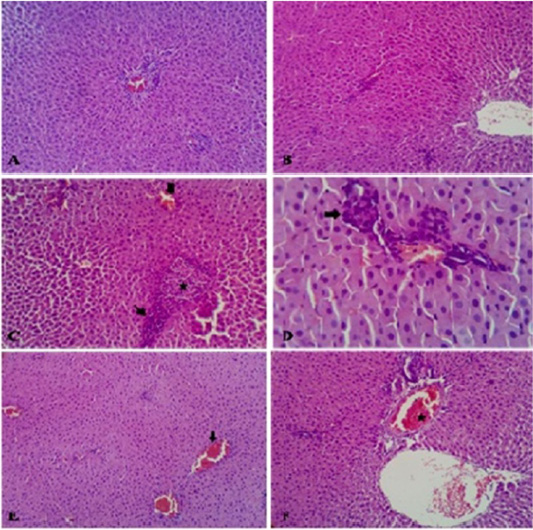
Photomicrograph of HandE stained liver from control rats showed normal hepatic parenchyma (A). Liver of rats from GAE group showed normal hepatic parenchyma (B). Liver of rats from IMI showed disorganization of hepatic cords replaced by mononuclear cells (star) which surrounded by lymphocytes (thin arrow) beside mild congested blood vessels (thick arrow) (C). Liver of rats from GAE/IMI showed mild portal inflammatory cells aggregations (D). Liver of rats from IMI/GAE showed normal hepatic parenchyma with mild congestion of the blood vessels (arrow) (E). Liver of rats from IMI+GAE group showed mild congested portal artery (star) with widening vein (F). H and E stain, (X 200).


