Advances in Animal and Veterinary Sciences
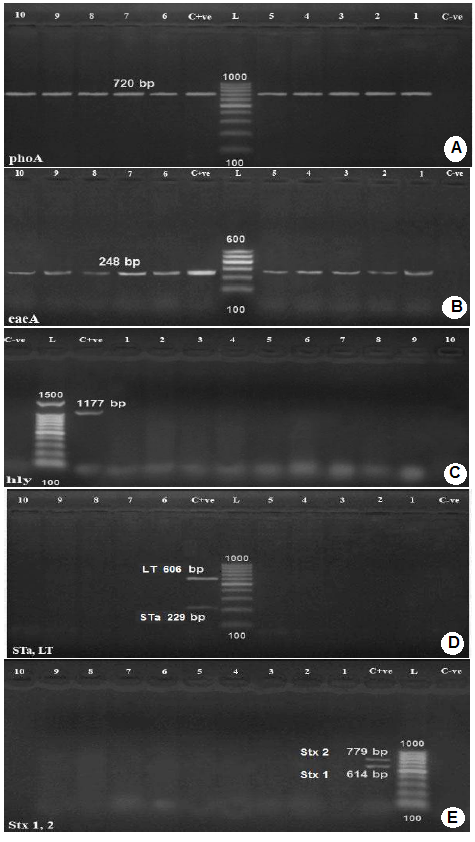
Agarose gel electrophoresis of PCR for detection of phoA gene in E. coli isolates.
Lanes 1,2,3,4,5,8,9,10,11,12: positive samples with band of amplicon size at 720 bp.
C+ve: Positive control.
L: Molecular weight marker (100 bp.)
C-ve: Negative control.
B): Agarose gel electrophoresis of PCR for detection of eaeA gene in E. coli isolates.
Lanes 1-10: positive samples with band of amplicon size at 248 bp.;
C+ve: Positive control.
L: Molecular weight marker ( 100bp.)
C-ve: Negative control.
C): Agarose gel electrophoresis of PCR for detection of hly gene in E. coli isolates.
C-ve: Negative control.;
L: Molecular weight marker (100 bp.)
C+ve: Positive control.
Lanes 4-13: negative samples.
D): Agarose gel electrophoresis of PCR for detection of Sta and LT genes in E. coli isolates.
Lanes 1,2,3,4,5,6,9,10,11,12: negative samples
C+ve: Positive control.
L: Molecular weight marker (100bp.);
C-ve: Negative control.
E): Agarose gel electrophoresis of PCR for detection of stx1 and stx2 genes in E. coli isolates.
Lanes 1-10: negative samples.
C+ve: Positive control.
L: Molecular weight marker (100bp.);
C-ve: Negative control.;


