Advances in Animal and Veterinary Sciences
Research Article

The Effects of Argania spinosa by Products Supplementation on Phenolic Compounds, Antioxidant Capacity and Mineral Composition of Camel Milk
Ikram Mercha1,2*, Nazha Lakram2, Mohammed Rachid Kabbour2, Mohammed Bouksaim2, Fouzia Zkhiri1, EL Haj EL Maadoudi2
1Laboratory of Virology, Microbiology & Quality / Eco-toxicology & Biodiversity. University Hassan II, Faculty of Science and Techniques of Mohammedia, PB 146 Mohammedia 20650 Morocco; 2RU Animal Production and Forage, Inra, Rcar-Rabat, PB 6570, Institutes Rabat, 10101, Rabat Morocco.
Abstract | Several studies have revealed optimal methods of cultivation and production of the Argane tree around the world. Certainly, Morocco includes the highest rate of production, however, many countries have started experimenting with promoting and using different products of this plant for its therapeutic and cosmetic virtues. The present work was conducted to evaluate the effect of using press oil cake and pulp from the Argane tree in animal feeding on different parameters of raw camel milk collected in the Ounagha region (Essaouira-Morocco). Here, the mineral contents and antioxidant capacity of seventy-eight milk samples collected from two camel populations were analyzed. The first population was characterized by a diet including Argane by products, whilst the second represented the control population. Results from this investigation demonstrated that camel milk samples consuming The Argane diet (AD) constituted an interesting supplement of natural antioxidants, especially that of total phenolic compounds (TPC). (TPC) of AD milk varied from 17.29 ± 0.61 to 22.65 ± 1.15 mg GAE/g of DM, while TPC of the control diet (CD) milk ranged from 10.74 ± 0.39 to 12.46 ± 0.33 mg GAE/g of DM. Furthermore, a mineral analysis demonstrated that AD milk samples were found to be rich in potassium, magnesium and other minerals with various health benefits. It is concluded that, the Argane diet (AD) could replace conventional diets for camels without any side effects and could therefore be used as a cost-effective feed source for camels in dry areas.
Keywords | Camel milk, Press oil cake, Argane tree, Antioxidant capacity, Phenolic compounds, Mineral content.
Received | February 27, 2019; Accepted | April 23, 2019; Published | June 26, 2019
*Correspondence | Ikram Mercha, Laboratory of Virology, Microbiology & Quality / Eco-toxicology & Biodiversity. University Hassan II, Faculty of Science and Techniques of Mohammedia, PB 146 Mohammedia 20650 Morocco; Email: ikram.mercha@gmail.com
Citation | Mercha I, Lakram N, Kabbour MR, Bouksaim M, Zkhiri F, El Maadoudi EH (2019). The effects of argania spinosa by products supplementation on phenolic compounds, antioxidant capacity and mineral composition of camel milk . Adv. Anim. Vet. Sci. 7(8): 648-656.
DOI | http://dx.doi.org/10.17582/journal.aavs/2019/7.8.648.656
ISSN (Online) | 2307-8316; ISSN (Print) | 2309-3331
Copyright © 2019 Ikram et al. This is an open access article distributed under the Creative Commons Attribution License, which permits unrestricted use, distribution, and reproduction in any medium, provided the original work is properly cited.
INTRODUCTION
Natural products have been gaining interest for playing a major role in preventing several diseases, which is especially shown through increasing consumer awareness for the use of natural bio-compounds from food sources instead of synthetic compounds that may have numerous toxic side effects (Alenisan et al., 2017).
Oxidative damage of cell components plays an important pathological role in human and animal diseases. This occurs due to the unbalance between highly reactive free radicals, particularly oxygen derived radicals that can be generated by exogenous factors (such as chemical’s exposition) or endogenous metabolism, and the human organism antioxidant potential, this can damage DNA integrity, membrane lipids and protein function leading to cell death and tissue damage (Abubakr et al., 2012).
Antioxidants derived from natural sources are likely to be more desirable than those chemically produced, which have been reported to have numerous negative side effects such as liver damage and carcinogenesis (Shori and Baba, 2011).
Dairy products remain one of the most interesting foods that contains antioxidant factors also by its abundance in naturally produced vitamins (i.e. E and C) (Pihlanto, 2006)
Camel milk is considered as a functional food having biological and therapeutic properties, especially that of its traditionally anti-bacterial proprieties due to its ability to produce various antimicrobial compounds (lactoferrin, lysozyme, lactoperoxidase and immunoglobulin) (Fguiri et al., 2012). The variability of camel milk’s mineral composition and its significant nutritional properties could be an important additional value for producers inthe dairy sector (Ahmed et al., 2014).
Many epidemiological studies have reported that the incidence of several types of diabetes and cardiovascular related diseases has decreased with the consumption of foods containing natural antioxidants (Marles and Farnsworth., 1997) and that an antioxidant therapy have a positive effect on the protection of pancreatic cells against apoptosis (Marmouzi et al., 2015). However, many factors can affect milk’s nutritive and antioxidant properties, such as milk treatment, breeding parameters and the stage of lactation (Alyaqoubi et al., 2014).
In this context, and with increasing studies reporting the identification of beneficial bio molecular compounds in various parts of the Argania spinosa’s (L.) Skeels (Elmounfalouti, 2013), The National Institute of Agricultural Researches (INRA Rabat) developed a diet formula based on Argania Spinosa’s press oil cake and pulp, that represents a strategic resource that may help filling the nutritional gap characterized in the national animal feedingby incorporating health-promoting substances and contributing to the use of underutilized food resources.
In this present study, we investigate how the incorporation of Argane tree by products in animal feed affectsthe mineral composition and antioxidantpotential of camel milk collected from Ounagha-Essaouira region, followed by its comparison to the milk of an Argane-free control population.
MATERIAL AND METHODS
Location, Diet and Animals
This study was carried out in the rural region of Ounagha (located 25 km from Essaouira, in the Marrakech-Safi region) for 90 days. The feeding experiment was conducted on two groups of camels with an average age of 10 to 12 years and at the 3rd and 4th month of lactation (considered as camel’s lactation peak), these camels were previously consuming a traditional diet. The first group of camels was given the Argane diet (AD) based on Argane sub products of whilst the second group continued a feeding systembased essentially on the control diet (CD). All animals had free access to drinking water and consumed ten (10) Kg of studied diets per day.The Argane diet (AD) contained Argane Press oil cake and pulp, wheat bran, grown straw, barely grain and a mineral/vitamin complement, while the control diet (CD), contained barley grain, Lucerne, wheat bran, ground straw, and trade food.
Samples of the ingredients and feeds were ground and stored in airtight plastic containers for analysis. Dry matter (DM), ash, ether extract (EE), crude fiber (CF), andcrude protein (CP) contents were determined according to the AOAC methods (AOAC, 2000). The chemical composition and the percentage of each ingredient in both diets are shown in Tables 1 and 2.
Table 1: Ingredients and chemical composition of the two diets
| Argane diet (AD) | Control diet (CD) | |
| Ingredients (g/100g of fresh matter) | ||
| Argane Press oil | 250 | 0 |
| Argane pulp | 200 | 0 |
| Ground straw | 100 | 170 |
| Wheat bran | 250 | 180 |
| Barley grain | 180 | 200 |
| Minerals and vitamins | 20 | 0 |
| Trade Food | 0 | 250 |
| Lucerne | 0 |
200 |
| Chemical composition: | ||
| Crude protein (%) | 16.35 | 11.49 |
| Dry matter (%) | 87.2 | 78.68 |
| Ash (%) | 6.56 | 7.37 |
| Crude fiber (%) | 12.9 | 10.30 |
| Ether extract (%) | 3.5 | 2.12 |
| Cost (dh/Kg DM) | 1.74 |
2.459 |
Sample Collection
Milk was regularly sampled each morning from camel herds by manual milking as normally practiced by the farmers. The milk of each camel was collected and placed in pre-sterilized glass bottles without preservatives and kept at 4°C. All samples were analyzed immediately on arrival to the Food Technology Laboratory at The National Institute of Agricultural Research in Rabat.
Mineral Estimation
The total mineral content of milk and feed was determined according to their specificity: The sodium (Na+) and potassium (K+) were determined using flame photometer, whilst the phosphorus (P) content was determined by a reaction of the acidified solution of ammonium molybdate including ascorbic acid and antimony (El Hamdani et al., 2016) with a measured absorption at 825 nm with UV-visible spectrophotometer (Jenway 6405 UV /VIS spectrometer) (Maurice. 1971). Trace elements, including iron (Fe2+), copper (Cu2+), zinc (Zn2+), calcium (Ca2+), and magnesium (Mg2+) were performed using atomic absorption spectrometry in an air-acetylene flame. Their measured absorbance was determined at a specific wavelength of 248.3 nm.
Table 2: Chemical Composition of Ingredients
| Ingredients | DM (%) | CF (%DM) | CP (%DM) | Ash (%DM) | EE (%DM) |
| Argane Press oil | 90.4 | 21.3 | 43.1 | 12.3 | 25.5 |
| Argane pulp | 76.14 | 15.4 | 7.79 | 4.12 | 8.23 |
| Ground straw | 88.5 | 42.5 | 3.4 | 8.2 | 0.3 |
| Wheat bran | 88.2 | 12.3 | 15.4 | 7.1 | 1.6 |
| Barley grain | 91.3 | 6.7 | 12.1 | 7.2 | 2 |
| Lucerne | 97.4 | 14.6 | 17.2 | 8.5 | 3.6 |
| Trade food | 87.77 | 12.06 | 19.18 | 6.8 |
2 |
DM: Dry Matter, CF: Crude fiber, CP: Crude protein, EE: Ether extract.
Sample Preparation and Antioxidant Extraction
Antioxidant compounds from fresh camel milk were extracted according to the methods of (Alyaqoubi et al., 2014). The solvent solution containing HCL (1N) and 95% of ethanol (v/v, 15/85) was prepared and used for the extraction procedure. This later involved adding 1 mL of the milk sample to 10 mL of the solvent, and the resulting mixture was placed in a rotary agitator set at 300 rpm during 1 hour at 30°C, then centrifuged at 7800 rpm for 15 min at 5°C. Finally, the recovered supernatant was stored at -20°C in the dark until further analysis.
As for the diets, after being grounded, they were extracted by adapting the method of Charrouf et al. (2007).
Measurement of Antioxidant Activity (Dpph) Inhibition Assay
The stock solution was prepared by diluting 40 mg of DPPH powder in 100 mL of methanol (Alyaqoubi et al., 2014). A volume of 1800ul of the DPPH solution was added to 200 ul of each fresh milk and diet extracts, and the mixture was vortexed and kept in the dark for 30 min (Soleymanzadeh et al., 2016). The absorbance was measured at 517 nm in wavelength, and the antioxidant activity was expressed as percentage of DPPH activity calculated as:
% Inhibition = [(Absorbance of blank – Absorbance of sample)/Absorbance of blank] × 100. (Musa et al., 2011).
Total Phenolic Content
The antioxidant capacity of each sample through TPC was determined according to (Shori and Baba, 2011) with minor modifications. 200 ul of fresh camel milk extract, was added to 1 mL diluted Folin – Ciocalteu reagent and 800 ul of Sodium carbonate solution.
After 2 hours of incubation, the absorbance was measured at 765 nm wavelength. A calibration curve of gallic acid was plotted, and results were expressed as milligrams of gallic acid equivalents per 100 g of dry weight (mg GAE / 100 g of DW).
The same dosing procedure was adapted for the studied diets phenolic content (Marmouzi et al., 2015).
Total Flavonoid Content
Total flavonoids were estimated by the method of (Bedascarrasbure et al., 2004) with minor modifications. 1mL of the milk and diet extracts was added to 1mL of a methanolic solution of Aluminium carbonate. After 10 min, the antioxidant activity through flavonoid content was analysed by reading the absorbance at 430 nm wavelength.
A calibration curve of quercetin was plotted, and results were expressed as milligrams of quercetin equivalents per 100 g of dry weight (mg QE/100 g of DW).
Statistical Analysis
Data were statistically treated using one-wayvariance analysis (ANOVA), results were shown as mean ± standard deviation, and differences among means were ranked using Duncan’s New Multiple Range Test. The significance level was considered at P<0.05.
RESULTS AND DISCUSSION
Diet Composition and Analysis
Ingredients percentage, chemical and mineral composition of both diets and ingredients are summarized in Tables 1, 2 and 3, respectively.
The AD contained Argane Press oil cake and pulp (250 g. kg-1 and 200 g. Kg-1 respectively) as protein and fatty matter source, wheat bran (250 g. Kg-1) and grownstraw (100 g. Kg-1) as fibre sources, barely grain (180 g. Kg-1) as a fermentable energysource as well as a mineral and vitamin source (20 g. Kg-1). The control diet (locally used) contained barley grain (200 g. Kg-1), trade food (250 g. Kg-1), wheat bran (180 g. Kg-1), grown straw (170 g. Kg-1), and Lucerne (200 g. Kg-1).
Compared to the control diet (CD), the Argane diet (AD) contained more CP (16.35% vs. 11.49%),more CF (12.9 vs. 10.30%), more EE (3.5 vs. 2.12%), but less ash (6.56 vs. 7.37%) on a DM basis (Table 1).
Study findings have revealed higher protein content comparing to a prepared diet that contains Argane press cake, (16,35 vs 14.25%) (Mouhaddach et al., 2016), and since the AD diet held a larger quantity of Argane’s sub products, it represents a good source of protein (43.1 % for the press oil cake and 7.79 % for the pulp).
Previous research conducted with grass hay and concentrate in Kenya showed lowercrude protein content in the grass hay (5.4 vs 16.35%) and lower ether extract compared to the Argane diet, representing an economic alternative to conventional diets given the increase cost of concentrate (Bekele et al., 2011).
Mean contents of each mineral found in both diets expressed in g/kg DM are shown in Table 3.
Table 3: Mineral composition of treatment feeds used in the feeding (g/Kg DM).
| Minerals | Argane Diet (AD) | Control Diet (CD) | |
|
Na (%) |
Mean±Sd | 7.16 ±0.21 | 5.43 ±0.20 |
| Significance | <0.001(***) | ||
|
K (%) |
Mean±Sd | 2.12 ±0.08 | 1.78 ±0.06 |
| Significance | 0.0049(**) | ||
|
P (%) |
Mean±Sd | 6.10 ±0.10 | 4.25 ±0.10 |
| Significance | <0.001(***) | ||
|
Ca (%) |
Mean±Sd | 5.27 ±0.05 | 3.34 ±0.19 |
| Significance | <0.001(***) | ||
|
Mg (%) |
Mean±Sd | 4.57 ±0.15 | 3.28 ±0.14 |
| Significance | <0.001(***) | ||
|
Zn (%) |
Mean±Sd | 3.30 ±0.11 | 2.51 ±0.14 |
| Significance | <0.001(**) | ||
P : Phosphorus, Na : Sodium, K : potassium, Ca : Calcium, Mg : Magnesium, Zn : Zinc.
***P < 0.001, ** P<0.01, *P < 0.05, ns: not significant (P > 0.05).
Each reading is mean±SEM (standard error of the mean) of triplicate analyses.
Calcium is a major nutrient for bone health as well as for nutrition (Bashir et al., 2014). The Argane diet is a rich source of Ca (5.27 ±0.05 g/Kg DM) and Mg (4.57 ±0.15 g/Kg DM), and it also contains considerable amounts of Zinc (Zn) (3.30 ±0.11 g/Kg DM), Phosphorus (P) (6.10 ±0.10 g/Kg DM), Potassium (K) (2.12 ±0.08 g/Kg DM), and Sodium (Na) (7.16 ±0.21 g/KgDM).These results are higher than those registered for the Control diet: (Ca) (3.34 ±0.19g/Kg DM), (Mg) (3.28 ±0.14g/Kg DM), (Zn) (2.51 ±0.14g/Kg DM) , (P) (4.25 ±0.10 g/Kg DM), (K) (1.78 ±0.06 g/Kg DM) and (Na) (5.43 ±0.20 g/Kg DM).
The feeding system had influence on all mineral concentrations, with very significant differences (P < 0.001) registered between both treatments except for the potassium (P<0.01). The consumption of the AD, demonstrated to be rich in minerals which will lead to improve animal’s critical biological functions like nerve conduction, muscle contraction, cell adhesiveness, mitosis, and blood coagulation (Vaskonen, 2003).
Antioxidant Activity of The Diet
Many studies have reported that beneficial bio-molecular compounds have been identified from various parts of the Argania spinosa’s (L.) Skeels and can play an important role in fighting diseases, and as such, could be used in pharmaceutical and personal care products (El babili el al., 2010).
Figure 1 illustrates the DPPH radical scavenging activity, phenolics and flavonoid contents of both diets.
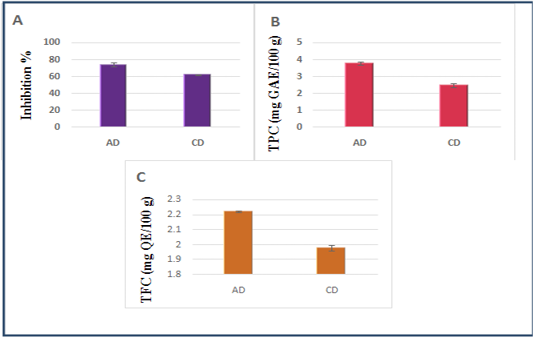
Figure 1: A- DPPH radical scavenging activity of the diets, B- Phenolics contents of the diets (mg GAE/100 g DM), C- Flavonoids contents of the diets (mg QE/100 g DM). Data are presented as mean ± SEM, n = 3 experiments, p values; *p < 0.05, **p < 0.01,***p < 0.001. AD: Diet including Argane sub products; CD: Control diet.
In the present study, the highest antioxidant value (DPPH radical scavenging) was registered in AD (74.32±2.34%) compared to CD (62.22±0.38%).
The Argane diet demonstrated promising TPC values (3.78±0.10 mg GAE/100 g DM) vs (2.47±0.12mg GAE/100 g DM) for CD, and the TFC values were also higher for AD than CD:(2.22±0.005 mg QE/100 g DM) vs (1.98±0.02 mg QE/100 g DM). Significant differences
Table 4: Milk mineral concentrations (mg/l) of camel as related to diet type and lactation stage.
| Parameter | Lactation weeks | |||||||||
| Diet | W1 | W 2 | W 3 | W 4 | W 5 | W 6 | Mean± SEM | Significance | ||
| P | AD |
644.87± 13.59 |
661.45± 11.91 |
681.89± 8.54 |
694.47± 10.34 |
704.68± 10.98 |
718.79± 11.81 |
684.36± 11.195 |
<.0001 (***) |
|
| CD |
603.65± 8.49 |
600.01± 15.10 |
598.88± 3.36 |
601.79± 3.68 |
607.53± 1.57 |
610.67± 3.02 |
603.755± 5.87 |
|||
| Mean±SEM |
624.26± 11.04 |
630.73± 13.505 |
640..385± 5.95 |
648.13± 7.01 |
656.105± 6.275 |
664.73± 7.415 |
644.06± 8.532 |
|||
| Significance | 0.0847 (ns) | |||||||||
| Na | AD |
681.48± 5.61 |
693.37± 5.16 |
701.04± 5.31 |
711.20± 6.18 |
720.32± 5.69 |
738.23± 5.02 |
707.61± 5.495 |
<.0001 (***) |
|
| CD |
643.17± 24.12 |
652.7± 25.01 |
654.70± 20.98 |
657.15± 17.15 |
642.76± 12.11 |
635.14± 6.67 |
647.61± 17.67 |
|||
| Mean±SEM |
662.325± 14.865 |
673.035± 15.085 |
677.87± 13.145 |
684.175± 11.665 |
681.54± 8.9 |
686.685± 5.845 |
677.61± 11.582 |
|||
| Significance | 0.1589(ns) | |||||||||
| K | AD |
1594.0± 16.10 |
1620.07± 15.82 |
1636.01± 16.28 |
1659.18± 14.55 |
1674.24± 16.02 |
1689.68± 16.06 |
1645.03± 15.805 |
<.0001 (***) |
|
| CD |
1436.53± 24.16 |
1436.87± 16.89 |
1439.00± 2.61 |
1463.37± 19.3 |
1470.87± 28.35 |
1476.43± 35.34 |
1453.845± 21.108 |
|||
| Mean±SEM |
1515.265± 20.13 |
1528.47± 16.355 |
1534.505± 9.445 |
1561.275± 16.925 |
1572.555± 22.185 |
1583.055± 25.7 |
1549.437± 18.456 |
|||
| Significance | 0.0238(*) | |||||||||
| Ca | AD |
1330.03± 39.70 |
1351.17± 43.08 |
1379.59± 43.15 |
1401.22± 43.09 |
1424.31± 43.89 |
1447.15±4 3.38 |
1388.911± 42.715 |
<.0001 (***) |
|
| CD |
1078.33± 26.19 |
1094.60± 36.61 |
1111.00± 29.16 |
1139.33± 8.29 |
1111.00± 14.57 |
1120.17± 13.29 |
1109.017± 21.352 |
|||
| Mean±SEM |
1204.18± 32.945 |
1222.885± 39.845 |
1245.295± 36.155 |
1270.275± 25.69 |
1267.655± 29.23 |
1283.66± 27.835 |
1248.964± 32.034 |
|||
| Significance | 0.7229(ns) | |||||||||
| Mg | AD |
145.87± 7.83 |
152.55± 8.35 |
159.75± 7.51 |
163.23± 6.96 |
163.7± 6.89 |
168.90± 6.37 |
159.00± 7.273 |
<.0001 (***) |
|
| CD |
116.23± 1.36 |
116.16± 1.31 |
114.77± 1.29 |
115.50± 1.47 |
115.86± 1.62 |
116.33± 1.09 |
115.808± 14.3 |
|||
| Mean±SEM |
131.05± 4.595 |
134.355± 4.83 |
137.26± 4.4 |
139.365± 4.215 |
139.78± 4.255 |
142.615± 3.73 |
137.404± 10.786 |
|||
| Significance | 0.8742 (ns) | |||||||||
| Zn | AD |
6.49± 0.27 |
7.29± 0.19 |
7.69± 0.18 |
8.22± 0.15 |
8.68± 0.16 |
8.786± 0.16 |
7.859± 0.185 |
<.0001 (***) |
|
| CD |
4.00± 0.12 |
4.00± 0.12 |
4.19± 0.26 |
4.50± 0.21 |
4.58± 0.05 |
4.51± 0.09 |
4.297± 0.142 |
|||
| Mean±SEM |
5.245± 0.195 |
5.645± 0.155 |
5.94± 0.22 |
6.36± 0.18 |
6.63± 0.105 |
6.648± 0.125 |
6.078± 0.1635 |
|||
| Significance | <.0001(***) | |||||||||
| Fe | SD |
2.84± 0.15 |
3.07± 0.13 |
3.35± 0.15 |
3.62± 0.13 |
3.85± 0.11 |
3.95± 0.11 |
3.446± 0.13 |
<.0001 (***) |
|
| CD |
1.86± 0.18 |
1.93± 0.06 |
2.03± 0.03 |
2.16± 0.15 |
2.23± 0.18 |
2.34± 0.14 |
2.091± 0.01 |
|||
| Mean±SEM |
2.35± 0.165 |
2.5± 0.095 |
2.69± 0.09 |
2.89± 0.14 |
3.04± 0.145 |
3.145± 0.125 |
2.768± 0.14 |
|||
| Significance | 0.0002(***) | |||||||||
P: Phosphorus, Na: Sodium, K: potassium, Ca: Calcium, Mg: Magnesium, Zn: Zinc, Fe: Iron.
***P < 0.001, ** P<0.01, *P < 0.05, ns: not significant (P > 0.05).
Each reading is mean±SEM (standard error of the mean) of triplicate analyses.
have been registered for all antioxidant parameters, between both diets (P < 0.05).
Higher antioxidant capacity in camel’s diet will improve its commercial value as an animal nutrient related to therapeutic properties.
Milk Mineral Concentrations
The mean and range of milk mineral concentrations according to diet type and lactation week are given in Table 4. All mineral levels were higher in the milk collected from camels fed with Argane sub-products (AD), than the milk received from camels fed by the local diet (CD) (p<0.001).
Sodium content ranges between 681.48± 5.61 and 738.23±5.02 mg/L at the sixth week of lactation, with an average of 707.61±5.495 mg/Lfor theAD, and between 643.17±24.12 and 657.15±17.15mg/L with an average of 647.61±17.67 mg/L for the CD.
The Sodium AD values are higher to those found by Sawaya et al. (1984) (668.5±13.8mg/L).
Potassium AD levels were higher than theCD collected milk (1645.03±15.805 vs 1453.845±21.108 mg/L). The AD values were higher than those previously reported by Sawaya et al. 1984 (1511.7±39.1 mg/L), however lower than those reported by Farah, 1993 (1730 mg/L). It is known that the levels of sodium and potassium can be affected by the feeding system and the stage of lactation (Sboui et al., 2009).
Phosphorus and calcium are essential constituents of milk and are important to bone growth and development of the growing neonate, and their means were respectively 684.36±11.195 and 1388.911±42.715 mg/L for AD, whereas they were 603.755±5.87 and 1109.017±21.352 mg/L for CD. These contents are higher than those reported by Mehaia and Al-Kahnal, 1989 (P: 580mg/L, Ca :1060 mg/L) and Gnan and Sheriha. (1986) (P: 630 mg/L, Ca :1320 mg/L).
Iron is essential for the transport of oxygen by hemoglobin, the average of iron content in the analyzed camel milk samples was 3.446 mg/L ±0.13 and 2.091±0.01 mg/L for AD and CD diets, respectively.The AD values are much higher than Sawaya et al. 1984 (2.5±0.2 mg/L).
Zinc and magnesium are essential components of many tissue enzymes needed by the body (Mouhaddach et al., 2016). There concentrations in the collected milk were respectively 7.859±0.185mg/L and 159.00±7.273mg/L for camels consuming AD diet and 4.297±0.142mg/L and 115.808±14.3mg/L for those consuming CD diet. The AD results remain higher to those given by Sawaya et al. 1984 (Zn: 4.3±0.4 mg/L, Mg :116.2±1.9 mg/L) and those reported by Hassan et al. (1987) (Mg: 80 mg/L).
The Argane diet can be used to improve and maintain camel milk’s mineral composition in dry season feeding systems, especially with the health organizations and officials worldwide currently recommendation for increasing mineral intake in our dietary approaches (Vaskonen, 2003).
Dpph Radical Scavenging Activity of Milk
Scavenging of DPPH radical is considered the basis of DPPH antioxidant assay (Marmouzi et al., 2015). The DPPH radical scavenging activity of camel milk as related to diet type and lactation stage, is described in Figure 2. Significant differences have been registered between both diets (P < 0.05). Milk collected from camels consuming AD showed higher levels of antiradical activity with an inhibition average of (74.22 ± 0.075 %) at the sixth stage of lactation, compared to the ones consuming CD (63.44 ± 0.23 %). The AD values are also higher than those reported by Balakrishnan and Agrawal (2012), for raw camel milk (64.4±01.42%), as well as those concerning fermented camel milk with lactic acid bacteria (62.03%) (El Hatmi et al., 2018). This shows that the nature of the diet consumed by camels is an important factor in increasing antioxidant potential in produced milk.
Phenolic and Flavonoid Contents
Phenolic and flavonoid contents are expressed respectively in mg of gallic acid or Quercetin equivalent per gram of dry weight (mg GAE/g DW - mg QE/g DW), seen in Figures 3, 4.
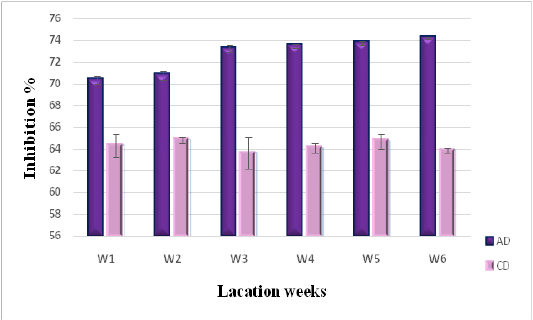
Figure 2: DPPH radical scavenging activity of camel milk as related to diet type and lactation stage. Data are presented as mean ± SEM, n = 3 experiments, p values; *p < 0.05, **p < 0.01, ***p < 0.001. AD: milk collected from camel fed by diet including Argane sub products; CD: milk received from camel fed by local diet.
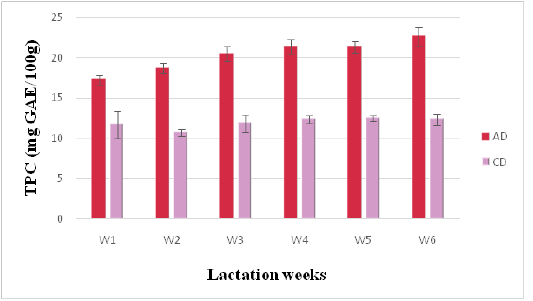
Figure 3: Phenolics contents of camel milk (mg GAE/100 g DM) as related to diet type and lactation stage. Data are presented as mean ± SEM, n = 3 experiments, p values; *p < 0.05, **p < 0.01, ***p < 0.001. AD: milk collected from camel fed by diet including Argane sub products; CD: milk received from camel fed by local diet
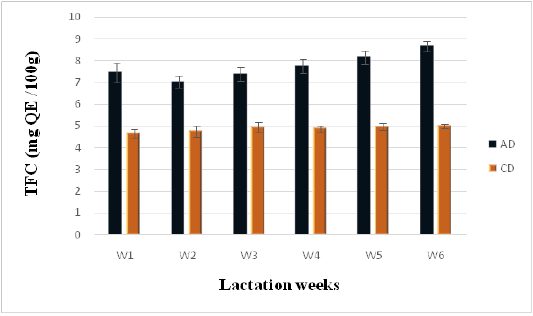
Figure 4: Flavonoids contents of camel milk (mg QE/100 g DM) as related to diet type and lactation stage. Data are presented as mean ± SEM, n = 3 experiments, p values; *p < 0.05, **p < 0.01, ***p < 0.001. AD: milk collected from camel fed by diet including Argane sub products; CD: milk received from camel fed by local diet.
Statistically significant differences (P < 0.05) in flavonoid content were observed between milk samples collected form camels following the Argane diet (AD) and those following the control diet (CD) (7.75 ± 0.15 vs 4.87 ± 0.07 mg QE/g of DW). However, results reported in literature concerning flavonoids in camel milk present many
ambiguities due to the lack of standardization or extraction methods.
Total Phenolic content (TPC) is a convenient indicator of a potential antioxidant activity (Marmouzi et al., 2015). TPC of AD milk varied from 17.29 ± 0.61to 22.65 ± 1.15 mg GAE/g of DW, while TPC of CD milk ranged from 10.74 ± 0.39 to 12.46 ± 0.33 mg GAE/g of DW. In these results, AD values are higher than those reported in a previous study (17.29 ± 0.61 mg GAE/g) (Alhumaid et al., 2010).
The inclusion of the Argane sub-products as a supplementation in camel feed showed significant improvement in the TPC and TFC levels in the collected milk, which shows an increased anti-oxidative activities promoted by interesting health benefits.
CONCLUSION
The present study revealed that the incorporation of Argane sub-products into camels’ daily diet improved the antioxidant potential of collected milk,in addition to its mineral composition and therefore, must be considered as a strong contribution to human nutritional therapy.
The production of the Argane diet (AD) cost 0.18 USD /kg of DM, considering only the ingredients purchase cost, while that the traditional diet (CD) costs 0.26 USD/kg of DM. This shows that the Argane diet is more economic than the conventional regime and could be an efficient alternative for the valorisation of Argane by-products and for camel feeding, thus improving the livelihood of farmers in dry areas while simultaneously integrating camel milk to human diets, resulting in with health promoting components.
Acknowledgment
The authors thank Dr. Zouahri Abdel Majid and Dr Douaik Ahmed from RU Environment and Conservation of Natural Resources, INRA, RCAR-Rabat for their kind help in mineral analysis. Outman Bouhlal and Aissam el Aliani are also thanked for their help and assistance in statistical study.
Research funding
This work is carried out with the support of the National Center for Scientific and Technical Research as part of the Research Excellence Fellowship Program.
Conflicts of interest
The authors declare no conflicts of interest.
authors contribution
El Haj El Maadoudi, Fouzia Zkhiri, and Ikram Mercha conceived and designed the experiments; Ikram Mercha performed the experiments; Fouzia Zkhiri, El Haj El Maadoudi, Lakram Nazha, Mohammed Rachid Kabbour , Mohammed Bouksaim and Ikram Mercha analyzed the data; Mohammed Rachid Kabbour , Fouzia Zkhiri, El Haj El Maadoudi, Nazha Lakram and Ikram Mercha contributed reagents/ materials/ analysis tools; Ikram Mercha wrote the paper, Fouzia Zkhiri and El Haj El Maadoudi read and approved the final manuscript.
References


