Advances in Animal and Veterinary Sciences
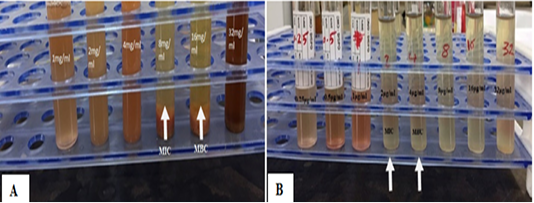
A MIC of C. erictus leaves extract against Staph.aureus , B: MIC of penicillin against Staph.aureus.
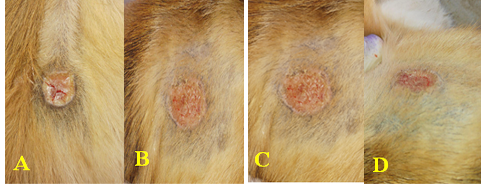
Scar tissue at 30th post operation A: control group B: treated one group C: treated two group D: treated three group
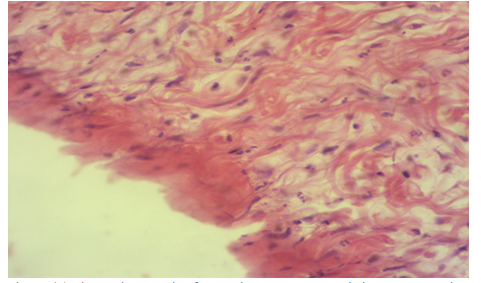
Photomicrography of T1 group of 15th days post operation showed scar tissue and irregular fibrosis at the wound area (H&E 100X).
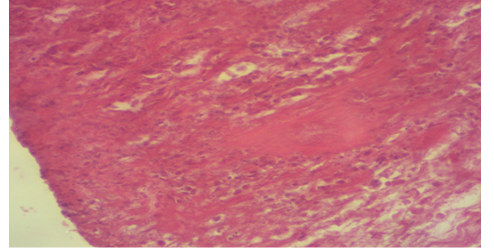
Photomicrography of control group at 30th days post operation showed new blood vessels, granulation of tissue invasion the area with the presence of active fibrosis (H&E 100X).
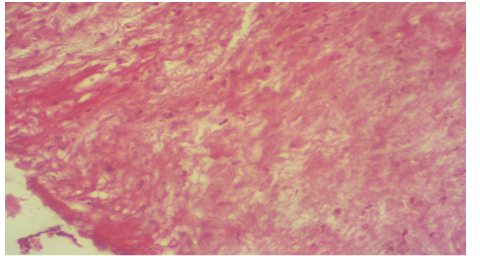
Photomicrography of T1 group at 30th days post operation showed thick scar tissue with presence of irregular connective tissue with inflammatory cells (H&E 100X).
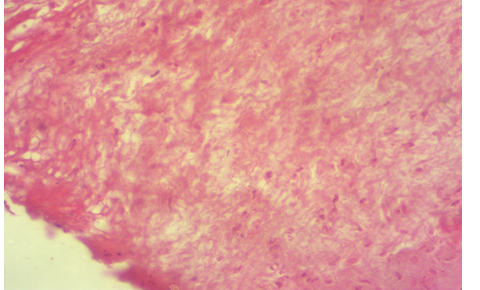
Photomicrography of T2 group at 15th post operation showed thin scar tissue with infiltration of inflammatory cells that invaded the connective tissue (H&E 100X).
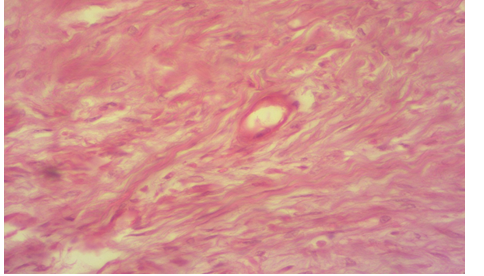
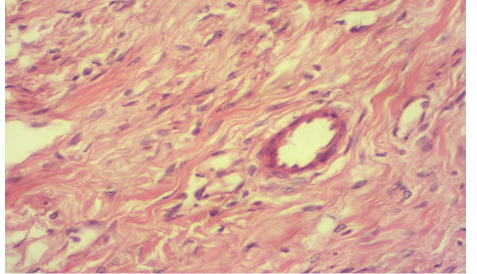
Photomicrography of T3 group at 15th post operation showed new blood vessels with presence of epithelization collagen deposition (H&E 100X).
Photomicrography of T2 group at 30th post operation showed irregular connective tissue with presence of epithelial cell with high collagen level (H&E 100X)
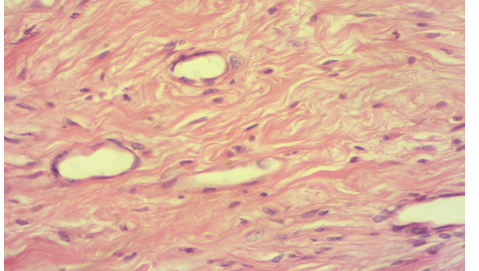
Photomicrography of treated three group at 30th post operation show normal epithelial cells with presence the blood vessels and still present inflammatory cells (H&E 100X).


