Advances in Animal and Veterinary Sciences
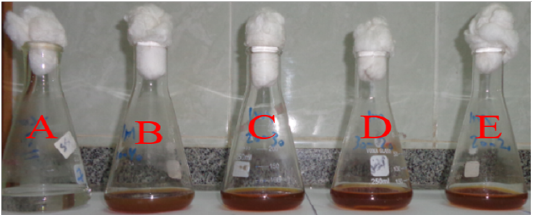
Color change indicates the creation of SNPs. (a) control flask (AgNO3 solution). b) after the 16h of interaction time of biosynthesis SNPs by the tested microbe (c) after the 24h. d) after the 32h. e) after the 40h.
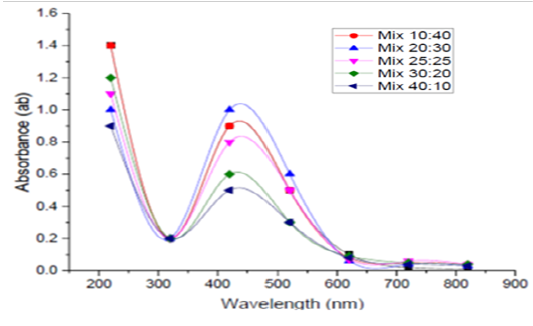
UV- Vis spectra of mixing ratio of culture supernatant and silver nitrate
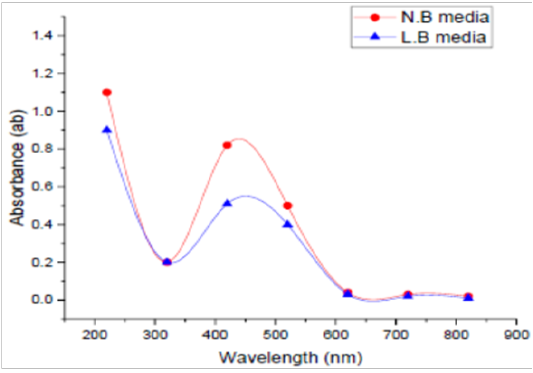
UV- Vis spectra of medium type used during SNPs biosynthesis
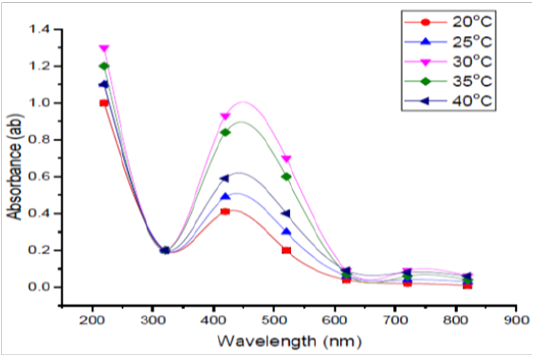
UV- Vis spectra of different temperatures used during SNPs biosynthesis.
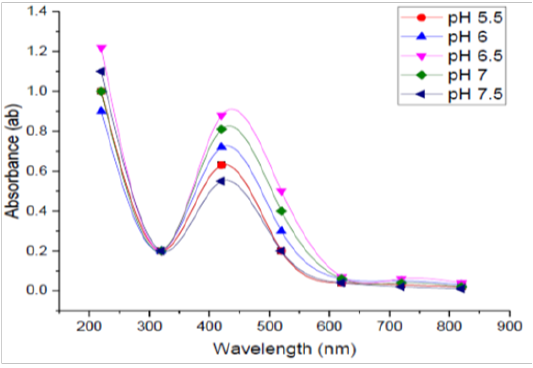
UV- Vis spectra of different pH values used during SNPs biosynthesis.
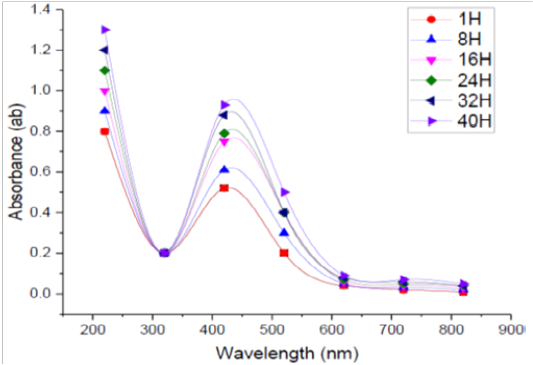
UV- Vis spectra of incubation times used during SNPs biosynthesis
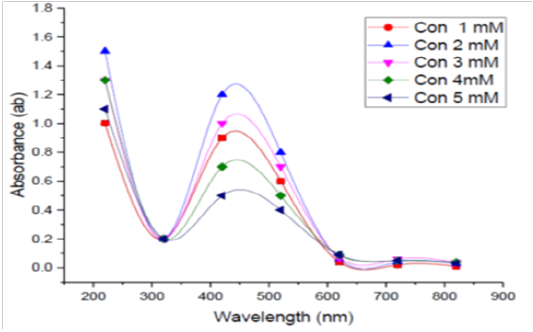
UV- Vis spectra of AgNO3 concentration used during SNPs biosynthesis
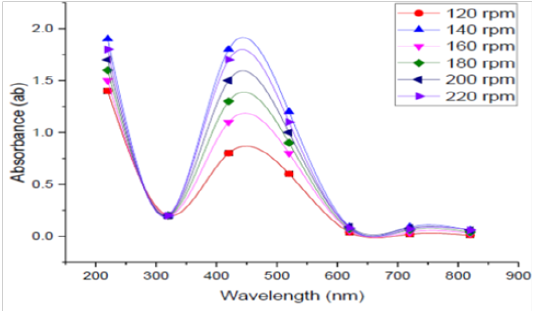
UV- Vis spectra of agitation speeds used during SNPs biosynthesis.
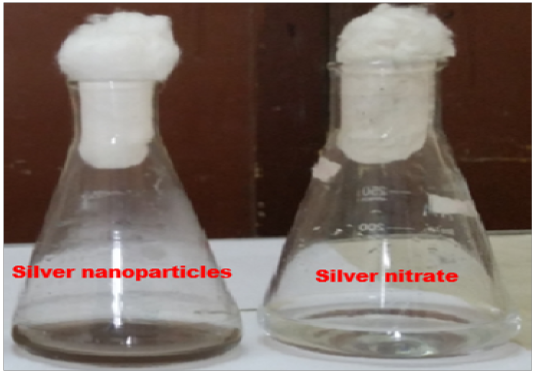
Color change indicates the creation of SNPs biosynthesis.
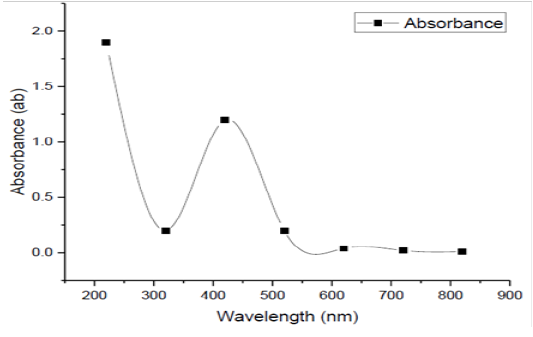
UV-Vis spectrum of SNPs biofabrication
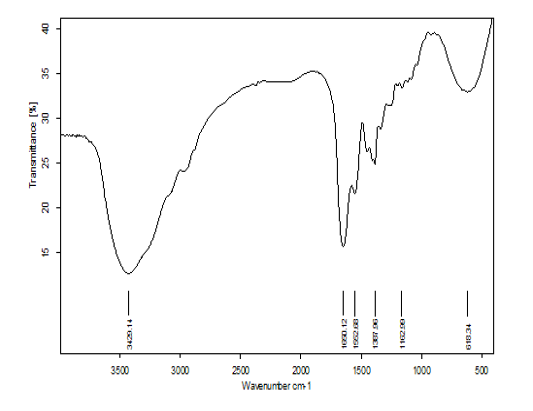
FTIR analysis of the biosynthesized SNPs by the tested bacterium.
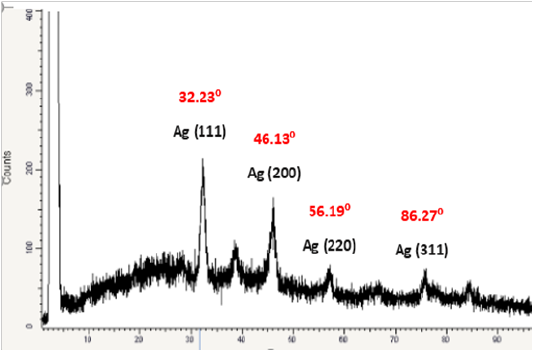
XRD spectra of SNPs biosynthesized by the tested bacterium.
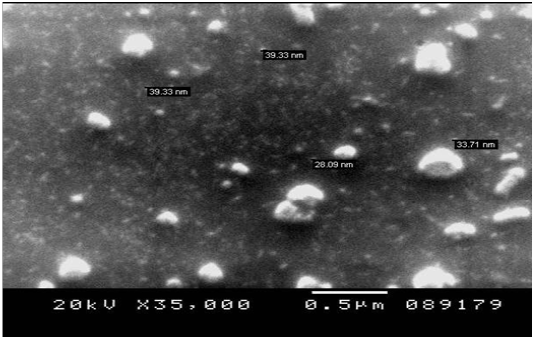
SEM electron micrograph of the SNPs biosynthesized by the tested bacterium.
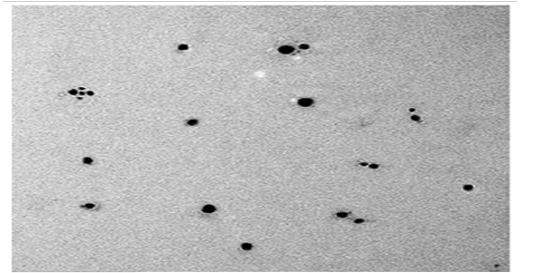
TEM electron micrograph of the SNPs biosynthesized.
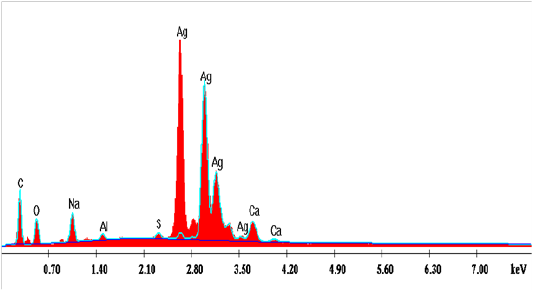
EDX spectra analysis of the biosynthesized SNPs
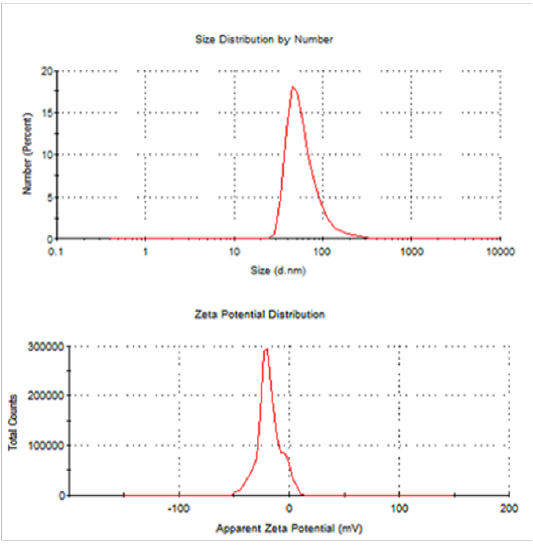
a. DLS, b. zeta potential of the synthesized SNPs by the tested bacterium


