Advances in Animal and Veterinary Sciences
Research Article

Increased Gliricidia sepium in Ration Containing Rice Straw on Rumen Fermentation and Microbial Protein Synthesis of Indigenous Bali Cattle
Ni Nyoman Suryani1*, I Gede Mahardika1, Nengah Sujaya2, Anak Agung Gunawan3
1Faculty of Animal Husbandry, Udayana University, Bali Indonesia; 2Faculty of Medicine and Health Science, Udayana University, Bali Indonesia; 3Faculty of Mathematics and Natural Sciences, Udayana University, Bali, Indonesia.
Abstract | An experiment was conducted to investigate Gliricidia sepium in ration containing rice straw on rumen fermentation and microbial protein synthesis (MPS) of indigenous Bali cattle. Randomized Block Design consisted of four ration treatments with three blocks of liveweight as replicate was used in this study. Average liveweights for group I, II and III were 195.25 kg, 230.5 kg and 241.75 kg, respectively. The four rations based on dry matter were: A (0% rice straw+15% Gliricidiasepium+45% elephant grass+10% calliandra+30% concentrate); B (10% rice straw+20% Gliricidia sepium+30% elephant grass+10% calliandra+30% concentrate); C (20% rice straw+25% Gliricidia sepium+15% elephant grass+10% calliandra+30% concentrate) and D (30% rice straw+30% Gliricidia sepium+0% elephant grass+10% calliandra+30% concentrate). Variables measured were digestible nutrient, rumen fermentation and MPS that were analyzed by analysis of variance. Results showed that the Total VFA and propionic acid were significantly (P<0.05) higher in cattle received ration containing more Gliricidia sepium, resulting in the highest MPS in ration C. The relationship between the Total of VFA concentration andMPSshowing in equation: Y = 2.633 X – 34.25 where Y = MPS(g/d) and X = Total VFA, with R2 = 0.77. It was concluded that formula diet containing 20% rice straw supplemented with 25% Gliricidia sepium, 15% elephant grass, 10% calliandra and 30% concentrate improved the Total VFA of ruminal fluid and MPS of indigenous Bali cattle.
Keywords | Gliricidia sepium, Rumen fermentation, Microbial protein synthesis, Bali cattle
Editor | Kuldeep Dhama, Indian Veterinary Research Institute, Uttar Pradesh, India.
Received | August 04, 2018; Accepted | November 16, 2018; Published | December 29, 2018
*Correspondence | Ni Nyoman Suryani, Faculty of Animal Husbandry, Udayana University, Bali Indonesia; Email: mansuryanifapet@unud.ac.id
Citation | Suryani NN, Mahardika IG. Sujaya N, Gunawan AA (2019). Increased gliricidia sepiumin ration containing rice straw on rumen fermentation and microbial protein synthesis of indigenous bali cattle. Adv. Anim. Vet. Sci. 7(3): 193-199.
DOI | http://dx.doi.org/10.17582/journal.aavs/2019/7.3.193.199
ISSN (Online) | 2307-8316; ISSN (Print) | 2309-3331
Copyright © 2019 Suryani et al. This is an open access article distributed under the Creative Commons Attribution License, which permits unrestricted use, distribution, and reproduction in any medium, provided the original work is properly cited.
INTRODUCTION
Forage is the major source of nutrition for ruminant in many situations. Rumen microbes are essential for ruminant production. They allow ruminants to transform plant forages, inedible for humans, into high-quality foods. Lignocellulose will therefore always be important in ruminant diets. Ruminants rely on rumen microbes to convert feed components into useable sources of energy and protein. Generally in Bali Province most of Hindu Balinese smallholder farmers always had their own property to grow crops or reared livestock traditionally and fed them with the available forage/feed nearby neighborhood (Nitis, 1997; Nitis et al., 2004). Nearly 70% of ruminant feed consisted of forages that their availability fluctuated due to seasons. Rice straw is the most potential agricultural waste and almost found in all of Indonesian regions as livestock feed particularly in dry season. However, rice straw is bulky where its crude protein content and its digestibility are relatively low. Degradable intake protein is a major limiting factor in the use of low quality forages. Therefore, the use of rice straw as livestock feed needs to be balanced with Gliricidia sepium leaves as a source of rumen degradable protein (RDP) containing approx. 88.7% (Nitis, 2007). By adding Gliricidia sepium to livestock feed using rice straw could provide a source of nitrogen (N) for the life of rumen microorganisms. Microbial protein synthesis requires adequate N to achieve maximum efficiency (Stern et al., 2006). Gliricidia sepium containing relatively high of 88.7% N and its degradability was also high i.e. 73.8% (Nitis, 2007). To maintain healthy rumen and activity of MPS, adequate dietary fiber is important to sustain a stable rumen environment.
Rumen is a complex ecosystem in which the feed eaten by ruminants will be fermented firstly by a variety of ruminal microorganisms. The end results of carbohydrate fermentation in the form of volatile fatty acids (VFA), which mainly consists of acetic, propionic and butyric acids will be used as energy sources by the host animal as well as by the microbes to synthesize protein (Wanapat, 2000). By increasing the population of ruminal microorganisms especially bacteria, not only increased fiber digestibility but it also became sources of high quality protein for ruminants. Microbial protein contributed up to 90% of the amino acids required by ruminants (Russell et al., 2009). Furthermore, amino acids provided microbial proteins were consistent and ideal to meet the ruminant’s requirement. Therefore, sufficient and balance nutrients in rumen are important to promote the maximum growth of ruminal microbes.This study was undertaken to evaluate the effect of Gliricidia sepium as source of RDP on ration containing rice straw on rumen fermentation and MPS of indigenous Bali cattle.
MATERIALS AND METHODS
Experimental Site
This experiment was conducted for 12 weeks started from July to October 2011 in Sukawati District Gianyar, Bali Province. Sukawati District is situated 8018’48” to 8038’58” south and 115013’29” to 115022’23” east with average temperatures 25.6 0C, and annual average relative humidity of 80%, total annual rainfall of 2,381 mm and average wind velocity of 6 knots (www.bmkg.go.id). A two week of adjustment period was taken in July 2011 prior the experiment to introduce the rations to Bali cattle.
Cattle and Design of Experiments
A randomized block design consisting of four ration treatments with three liveweight groups as replication was used in this study. A total of twelve fattening indigenous Bali cattle wereused in this study. Average liveweights for group I, II and III were 195.25 kg, 230.5 kg and 241.75 kg, respectively. Complete rations consisting of 70% forage and 30% concentrate were given in the mash form. The compositions of the rations are presented in Table 1, and the nutrient content of the rations in Table 2. The rations and water were provided fresh every morning at 08.00 and supplied ad libitum.
Digestible Nutrient
Digestible Nutrient measured for a 7 days of total collection period. The total collections were observed for 24 hours of a period for the seven days i.e. started from 08:00 a.m. All rations and the remaining of the rations were sampled about 200 gram every day during the total collection period. At the end of the total collection period they were mixed and decomposed and analyzed for nutrient contents. Similarly, it was done to determine the nutrient contents in the faeces, too. The digestible nutrient is calculated by the following formulas:
Digestible Dry Matter (g/d) = Dry Matter Intake (g) – Dry Matter faeces (g)
Digestible Organic Matter (g/d) = Organic Matter Intake (g) – Organic Matter faeces (g)
Digestible Crude Protein (g/d) = Crude Protein Intake (g) – Crude Protein faeces (g)
Digestible Crude Fiber (g/d) = Crude Fiber Intake (g) – Crude Fiber faeces (g).
Table 1: Composition of four rations fed to Bali cattle for 12 weeks of experiment
| Composition of ration (% of Dry Matter) | Treatments | |||
| A | B | C | D | |
| Rice straw | 0.00 | 10.00 | 20.00 | 30.00 |
| Gliricidiasepium | 15.00 | 20.00 | 25.00 | 30.00 |
| Elephantgrass | 45.00 | 30.00 | 15.00 | 0.00 |
| Calliandra | 10.00 | 10.00 | 10.00 | 10.00 |
| Consentrate | 30.00 | 30.00 | 30.00 | 30.00 |
|
Total |
100.00 | 100.00 | 100.00 |
100.00 |
Rumen Fermentation Products
The parameters measured were rumen fermentation productsi.e. pH, concentration of N-NH3,Total VFA and VFA partial i.e. acetic, propionic and butyric acids. Ruminal fluid were taken 4 hours post feeding using a stomach tube and directly measured for its pH using a pH meter. N-NH3 levels were determined by Spectrophotometer according to Solórzano (1969). The total of VFA and VFA partial were analyzed by Gas Chromatography (GC) by AOAC (2005).
Microbial Protein Synthesis
Microbial protein synthesis was analyzed according Chen and Gomes (1995):
Digestible Organic Matter in Rumen/DOMR (kg/d) = Organic Matter x Organic Matter digestibility x 0.65
Microbial Nitrogen Production (MN) = 32 g/kg DOMR
Microbial Protein Synthesis (g/d) = MN x 6.25
Purine absorption (mMol/d) = MN : 0.727
Purin derivates excretion (mMol/d) = 0.85 purine absorption + 0.385 x W0.75
Allantoin excretion (mMol/d) = 0.85 x purin derivates excretion.
Table 2: Nutrient contents of four rations fed to Bali cattle for 12 weeks of experiment
| Nutrient contents (%DM) | Treatments | Kearl Standard (1982) | |||
| A | B | C | D | ||
| Energy (kcal/kg) | 3346.00 | 3307.00 | 3297.00 | 3109.00 | |
| Crude protein | 11.71 | 11.51 | 11.54 | 12.05 | 12.32 |
| Ether extract | 1.63 | 1.83 | 1.65 |
2.29 |
|
| Crude fiber | 25.36 | 25.94 | 25.53 | 21.59 | |
| Ash | 12.60 | 13.51 | 16.05 | 16.94 | |
| Total Digestible Nutrient | 60.98 | 59.65 | 58.65 | 60.91 | 66.07 |
| Calcium | 0.47 | 0.84 | 0.79 | 1.71 | 0.48 |
| Phosphor | 0.10 | 0.12 | 0.12 | 0.09 | 0.30 |
|
Neutral detergent fiber |
62.57 | 58.23 | 56.23 | 59.40 | |
| Acid detergent fiber | 45.48 | 42.76 | 38.10 | 36.95 | |
| Acid detergent lignin | 3.45 | 4.78 | 5.23 | 7.78 | |
Table 3: Effect of increased Gliricidia sepium in rations on digestible nutrient of indigenous Bali cattle
| Parameters | Treaments | SEM | |||
| A | B | C | D | ||
| Digestible Energy (kcal/d) | 14368.55 | 11779.95 | 14828.33 | 12208.86 | 1535.24 |
| Digestible DM (g/d) | 7766.35 | 6907.16 | 6743.58 | 7113.80 | 431.53 |
| Digestible OM (g/d) | 4838.07 | 4256.70 | 4099.80 | 4406.39 | 277.71 |
| Digestible CP (g/d) | 503.10 | 520.80 | 540.39 | 610.41 | 29.61 |
| Digestible CF (g/d) |
1240.26a |
1092.11a |
786.25b |
730.63b |
77.93 |
| Digestible EE (g/d) |
64.34a |
67.04a |
75.60a |
131.37b |
11.52 |
A = 0% rice straw + 15% Gliricidia sepium+ 45% elephant grass + 10% calliandra + 30% concentrate
B = 10% rice straw + 20% Gliricidia sepium+ 30% elephant grass + 10% calliandra + 30% concentrate
C = 20% rice straw + 25% Gliricidia sepium+ 15% elephant grass + 10% calliandra + 30% concentrate
D = 30% rice straw + 30% Gliricidia sepium+ 0% elephant grass + 10% calliandra + 30% concentrate
Numbers with different superscript in the same row are significantly different(P<0.05)
SEM = Standard Error of the Treatment Means
Data Analysis
The data were analyzed using ANOVA to determine the effect of treatments.When the results were significantly different among treatments (P<0.05), it was further analysed for the orthogonal contrast test at 5% level according to Steel et al. (2006).
RESULTS AND DISCUSSION
Digestible Nutrient
Digestible energy, digestible DM and OM were not significantly different (P>0.05). However, there the digestible CP tended to increase as the level of Gliricidia sepium increased (P>0.05). By adding the Gliricidia sepiumin rations promoted more N-NH3 production as N sources for MPS. Nitrogen supplementation for animals fed low-quality forage have been reported to favor the growth of fibrolytic bacteria, and increased the ruminal degradation, as well as the energy extraction from forage fiber (Detmann et al., 2009).
The higher the amount of rice straw in the rations the higher the ADL contents (Table 2) and the lower the crude fiber digestible (Table 3). The crude fiber digestible were significantly lower at the levels of 20% and 30% of rice straw in rations (P<0.05) (Table 3).
Rumen Fermentation Products
The higher the level of Gliricidia sepium in rations, the lower the pH of ruminal fluids (P<0.05) due to the higher of the Total VFA produced (P<0.05) particularly at the levels of 25% and 30% of Gliricidia sepium (Table 4). The pH of ruminal fluid ranged between 6.54 and 6.79 that promoted the optimal microbial growth. Results of this present study was supported by Chiba (2009) reported that the rumen fluid was normally 6-7 while Kamra (2005) reported that the optimum pH for microbial growth was 6 to 6.9.
Types and compositions of forage in the rations fed to the Bali cattle resulted in the pH ruminal fluid conditions for optimal growth for microbial as seen in Table 4. This findi-
Table 4: Effect of increased Gliricidia sepium in rations on rumen fermentation of indigenous Bali cattle
| Parameters | Treatments | SEM | |||
| A | B | C | D | ||
| pHofruminal fluid | 6.79a2) |
6.71ab |
6.54c |
6.59bc |
0.04 |
| NGR |
2.71. |
2.45. | 2.25. | 3.01. | 0.28 |
|
N-NH3 (mMol) |
13.09a |
18.34b |
13.13a |
19.82b |
1.17 |
| Total VFA (mMol) |
192.72a |
194.72a |
220.71b |
207.41b |
4.36 |
| Acetid acid (mMol) |
40.19a |
38.26a |
54.20b |
62.21b |
2.50 |
| Propionic acid (mMol) |
20.89a |
25.81b |
29.69c |
29.03c |
0.82 |
| Butyric acid (mMol) |
8.07a |
11.88b |
6.26c |
14.21d |
0.51 |
| Methane (mMol) |
18.91a |
18.62a |
25.56b |
30.95c |
1.27 |
A = 0% rice straw + 15% Gliricidia sepium+ 45% elephant grass + 10% calliandra + 30% concentrate
B = 10% rice straw + 20% Gliricidia sepium+ 30% elephant grass + 10% calliandra + 30% concentrate
C = 20% rice straw + 25% Gliricidia sepium+ 15% elephant grass + 10% calliandra + 30% concentrate
D = 30% rice straw + 30% Gliricidia sepium+ 0% elephant grass + 10% calliandra + 30% concentrate
Numbers with different superscript in the same row are significantly different (P<0.05)
SEM = Standard Error of the Treatment Means
Table 5: Effect of increased Gliricidia sepium in rations on DOMR and MPS of indigenous Bali cattle
| Parameters | Treatments | SEM | |||
| A | B | C | D | ||
| DOMR (kg/d) |
2.47 |
2.33 | 2.76 | 2.49 | 0.19 |
| Microbial N (g/d) | 79.16 |
74.56 |
88.35 | 79.66 | 6.16 |
| MPS (g/d) | 494.74 | 466.03 |
552.21 |
497.91 | 38.49 |
| Purine Absorption (mMol/d) |
108.88a |
102.56a |
121.53b |
109.58a |
1.21 |
| Purine Derivative Excretion (mMol/d) |
119.03a |
113.39a |
131.03b |
119.97a |
1.60 |
| Allantoin Excretion (mMol/d) |
101.18a |
96.38a |
111.38b |
101.98a |
2.18 |
A = 0% rice straw + 15% Gliricidia sepium+ 45% elephant grass + 10% calliandra + 30% concentrate
B = 10% rice straw + 20% Gliricidia sepium+ 30% elephant grass + 10% calliandra + 30% concentrate
C = 20% rice straw + 25% Gliricidia sepium+ 15% elephant grass + 10% calliandra + 30% concentrate
D = 30% rice straw + 30% Gliricidia sepium+0% elephant grass + 10% calliandra + 30% concentrate
Numbers with different superscript in the same row are significantly different(P<0.05)
SEM = Standard Error of the Treatment Means
ng was supported by Orskov and Ryle (1990) who reported that particle size and coarse feeds produced more saliva that acted as buffer. The ruminal fluid pH is a balance between the capacities of the buffer and alkaline or acidic nature of fermentation products. Ration C consisted of 20% rice straw and 25% Gliricidia sepium provided more optimal ruminal condition indicated by the highest productions of Total VFA and propionic acid (P<0.05). This finding is supported by Zang (2015) who reported that propionate produced from microbial carbohydrate digestion in ruminant is a major hepatic gluconeogenic substrate. Furthermore, propionate contributed 80-90% of the glucose synthesis in ruminant (Preston and Leng, 1987).
Non Glucogenic Ratio (NGR) value of cattle that received ration C tended to be lower among the four ration treatments (P>0.05). The low value was associated with the highest propionic acid produced i.e. 26.69 mMol (P<0.05) (Table 4).
N-NH3 concentration of rumen fluid of cattle that received ration C was also significantly lower i.e.13.13 mMol than of cattle that received rations B and D being 40.11% and 51.41%, respectively (P<0.05). This finding was supported by Hristov et al. (2004) who stated that ruminants had rich N-NH3 of rumen fluid when they were fed with rations that were rich in RDP.
Although ration C contained more Gliricidia sepium as a source of RDP had significantly lower N-NH3 rumen fluid, the Total VFA was significantly higher among the four ration treatments (P<0.05). This finding showed that the ration C was the best ration providing sufficient and balance sources of energy and protein indicated by the tendency of higher MPS production i.e. 552.21 g/d (P>0.05) (Table 5). This finding was supported by Karsli and Russell (2001) who stated that the usage of N-NH3 ruminal fluid for MPS was high when ruminants were fed with feed containing high soluble carbohydrate.
All four ration treatments fed to Bali cattle in this study resulted in N-NH3 concentration ranged between 13.09 mMol and 19.82 mMol that were optimal for rumen microbial growth as reported by McDonald et al. (2002).
Based on these results, the relationship between the MPS and a concentration of N-NH3 ruminal fluid showing in equation: Y = 891X-0.216, where Y = MPS (g/d) and X = N-NH3 concentration (mMol) with R2 = 0.43.
Differences in forage composition in the rations caused a various concentration of Total VFA of ruminal fluid of Bali cattle and the highest Total VFA of ruminal fluid was found in those fed with ration C then followed by rations D, B, and A (Table 4). Increased Gliricidia sepium as a source of RDP contributed to increasing the Total VFA as VFA was the major energy source for ruminants (Owen and Bergen. 1983; Preston and Leng, 1987). The Total VFA in the present study ranged between 192.72 mMol and 220.71 mMol that were higher than 80-160 mMol reported by Sutardi (1995) who stated that type of feed and time sampling on the Total VFA collection were factors affecting the Total VFA. Differences in forage composition in the rations resulted in significantly higher propionic acid concentration in rumen fermentation particularly of those cattle received rations C and D containing more rice straw (P<0.05) (Table 4). The highest concentration of propionic acid produced when Bali cattle fed ration C was 29.69 mMol (P<0.05). Similarly, concentrations of acetic acid and butyric acid produced also were highest in those cattle fed ration D that contained the highest portion of 30% rice straw i.e.62.21 mMol and 14.21 mMol, respectively (P<0.05). Acetic acid was substrate for lipogenesis while propionic acid was substrate for gluconeogenesis (France and Dijkstra, 2005).
The absence of rice straw in ration A resulted in significantly lower of methane production i.e. 18.91 mMol (P<0.05) (Table 4). This finding was supported by Angela et al. (2000) who reported that higher production of acetic and butyric acids stimulated higher production of methane.
Microbial Protein Synthesis
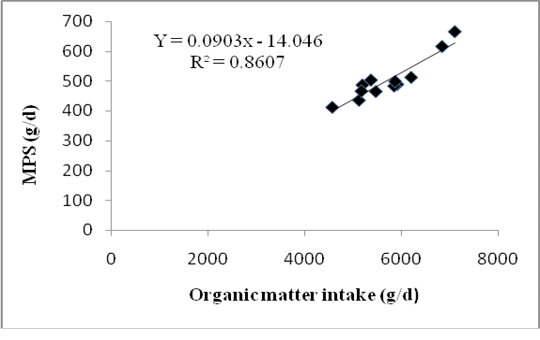
Differences in forage composition in the rations did not affect significantly the digestible organic matter in the rumen (DOMR), microbial N and MPS of Bali cattle although ration C tended to produce higher being 2.76 kg/d DOMR, 88.35 g/d microbial N and 552.21 g/d MPS (P>0.05) (Table 5). However, 121.53 mMol/d of purine absorption,131.03 mMol/d of purine derivatives and 111.38 mMol/d of allantoin excretions of Bali cattle fed with ration C were significantly higher among allration treatments (P<0.05). Highest MPS in cattle fed with ration C was due to the highest DOMR fermented from a mixture of sufficient rice straw and Gliricidia sepium that promoted optimum growth of microbes. Insufficient energy supply in ration was usually the first limiting factor for microbial growth in rumen. The relationship between the MPS and Organic Matter Intake showing in equation: Y = 0.0903X - 14.046, where Y = MPS (g/d) and X = OM intake with R2 = 0,79. The graph of relationship between organic matter intake and MPS presented in Figure 1.
Ration containing rice straw supplemented with cassava chips obtain MPS 559 g/d; but when added urea, MPS decreased to 422 g/d (Wanapat, 2000).
Bali cattle reared in Nongan Village, Karangasem Regency of Bali Province that were fed with forage consisted of Gliricidia sepium, elephant grass, calliandra, jackfruit leaves and cassava produced 663.67 ± 47.38 g/d of MPS (Suryani et al., 2018). Differences or even similar in forage composition of rations resulted in varied concentration of MPS (Pathak, 2008; Karsli and Russell, 2001). The average efficiency of MPS was 13.0 MCP/100g for forage based diets, 17.6 MCP/100g for forage: concentrate mix diets, and 13.2 MCP/100g for concentrate diets of OM truly digested in the rumen. Overall, the average efficiency of MPS was 14.8 MCP/100g of OM truly digested in the rumen (Pathak, 2008).
Pengola grass fed to bulls resulted in 316 g/d of MPS with an efficiency of 71.8 g/d of MPS reported by Mullik (2007) while feeding forage and concentrate rations resulted in 70-279 g/kg DOMR (Karsli and Russell, 2001).
Increased MPS in this studywas due to the increased DOMR. Increasing consumption of dry matter resulted in increasing passage rate (flow rate) to the rumen digesta as well as the intestinal bacteria (Karsli and Russell, 2001). The faster the passage rate toward the intestinal bacteria, the less energy needed by bacteria to maintenance as well as compensation; thus the energy could be used for the growth of other bacteria.
Crude protein was crucial component for the production of MPS that indicated by the availability of N to the rumen microbes as long as the N concentration was sufficient and protein was not used as energy source (Gosselink et al., 2003). Differences in sources of carbohydrates fed to ruminants resulted indifferences in rumen microbial growth (Stern et al., 2006). Type and the availability of carbohydrates were the important factors affecting the utilization of protein degradation products (Nitrogen). Non-structural carbohydrates, although they were iso-calorific, increased the rumen microbial growth. The rate of carbohydrate digestion was one of the determinants of rumen microbial protein production. The relationship between Total VFA concentration and MPS showing in equation: Y = 2.633 X – 34.25 where Y = MPS (g/d) and X = Total VFA, with R2 = 0.77. The graph of this relationship is presented in Figure 2.
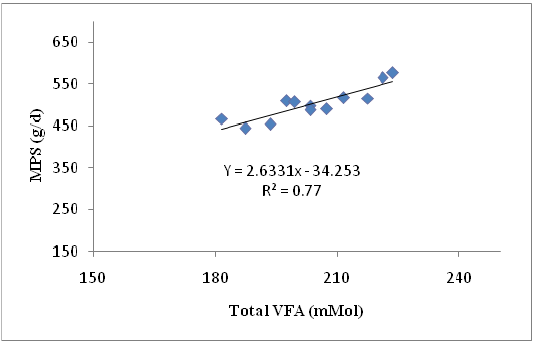
Figure 2: The relationship Total VFA and MPS
In the present study, when 30% Gliricidia sepium provided in ration D, the MPS was lower i.e. 497.91 g/d than of 552.21 g/d when 25% Gliricidia sepium provided in ration C. Increasing the nitrogen consumption by Bali cattle that was apparently supplied by rice straw as subjected in ration D was not followed by the increasing in energy consumption that was apparently supplied by Gliricidia sepium as protein source. The imbalance between energy and protein sources that could be utilized by rumen microbes particularly bacteria resulted in lower concentrations of the Total VFA, DOMR productions and more crucial was declining in MPS concentration. This finding was in line with Stern et al. (2006) who stated that differences in forage composition in the rations were important to ensure the sufficient balance of energy and protein supplies for the optimum ruminal microbe growth. When an excess of protein supply provided in rations, more nitrogen would be lost as N-NH3 and vice versa, when an excess of energy supply provided this accelerated the speed of carbohydrate degradation thus reduced MPS.
Ruminant feed usually contained nucleic acids that were extensively fermented by microbes and passed on into abomasum and duodenum. Rumen microbes were rich in nucleic acids where 18% of the total N in the form of microbial nucleic acid or 11% in the form of purines. Purine nucleic acids were metabolized and excreted through urine in the form of derivatives of allantoin, uric acid, xanthine and hypoxanthine (Chen and Gomes, 1995). Allantoin urine was used to estimate microbial protein production (Lamothe et al., 2002). Results in the present study indicated that purine absorption, excretion of purine derivatives and real allantoin excretion were highest in the cattle receiving ration C among the four ration treatments (P<0.05).
CONCLUSIONS
The present study showed that the ration C containing 20% rice straw supplemented with 25% Gliricidia sepium, 15% elephant grass, 10% calliandra and 30% concentrate improved the sufficient balance of the availability of sources energy and protein thus produced the highest MPS of indigenous Bali cattle.
ACKNOWLEDGEMENTS
The authors would like to express sincere gratitude to Bali cattle breeder for allowing their cattle to be used in this experiment. The authors also were grateful for the Head and staffs of the Laboratory of Animal Nutrition and Feedstuff, Faculty of Animal and Husbandry, Udayana University for analyzing the rations used in this experiment.
conflict of interest
We all authors declare that there is no conflict of interests.
authors contribution
Ni Nyoman Suryani: the main researcher in completing the research. I Gede Mahardika and Nengah Sujaya : Scientific Supervisor. Anak Agung Gunawan: Assisted in analyzed the data. All authors contributed in correcting the article.
REFERENCES


