Advances in Animal and Veterinary Sciences
Research Article

Effects of Phloroglucinol and the Forage:concentrate Ratio on Methanogenesis, In vitro Rumen Fermentation, and Microbial Population Density
Ki Ageng Sarwono1,2, Makoto Kondo1, Tomomi Ban-Tokuda1, Anuraga Jayanegara2,3, Hiroki Matsui1*
1Graduate School of Bioresources, Mie University, 1577 Kurimamachiya-cho, Tsu, Mie 514-8507, Japan; 2Animal Science Modelling Research Group (ANSIM), Faculty of Animal Science, Bogor Agricultural University, Indonesia; 3Department of Nutrition and Feed Technology, Faculty of Animal Science, Bogor Agricultural University, Bogor 16680, Indonesia.
Abstract | This study was conducted to investigate the effects of phloroglucinol (PHLO) and the forage: concentrate ratio (F:C) on methane (CH4) production, rumen fermentation profiles, and the microbial population in vitro. Rumen fluid was collected from male Friesland sheep using a stomach tube before the morning feeding. The treatments comprised two different diets: a low F:C diet (20:80) and high F:C diet (80:20), and three PHLO doses (0, 6, and 10 mmol/L PHLO). The results showed that PHLO lowered CH4 production in both diets, whereas F:C did not have any effect on CH4 production. The CH4 decrease due to PHLO was accompanied by a simultaneous decrease in the relative quantity of methanogens and dry matter digestibility (DMD). This indicated that PHLO might decrease CH4 by directly inhibiting methanogen growth and by indirect effects through the retardation of digestibility. PHLO lowered total short-chain fatty acid (SCFA) production with the low F:C diet but increased total SCFA production with the high F:C diet. PHLO increased acetate production in high F:C diet but lowered acetate production of low F:C diet. This finding showed that PHLO might redirect rumen fermentation from CH4 production to acetate production. PHLO lowered the relative quantity of Ruminococcus albus, which might explain the retardation of digestibility by PHLO.
Keywords | Methane, Phloroglucinol, Rumen
Editor | Kuldeep Dhama, Indian Veterinary Research Institute, Uttar Pradesh, India.
Received | May 25, 2018; Accepted | November 26, 2018; Published | December 29, 2018
*Correspondence | Hiroki Matsui, Graduate School of Bioresources, Mie University, 1577 Kurimamachiya-cho, Tsu, Mie 514-8507, Japan; Email: matsui@bio.mie-u.ac.jp
Citation | Sarwono KA, Kondo M, Ban-Tokuda T, Jayanegara A, Matsui H (2019). Effects of phloroglucinol and the forage:concentrate ratio on methanogenesis, in vitro rumen fermentation, and microbial population density. Adv. Anim. Vet. Sci. 7(3): 164-171.
DOI | http://dx.doi.org/10.17582/journal.aavs/2019/7.3.164.171
ISSN (Online) | 2307-8316; ISSN (Print) | 2309-3331
Copyright © 2019 Sarwono et al. This is an open access article distributed under the Creative Commons Attribution License, which permits unrestricted use, distribution, and reproduction in any medium, provided the original work is properly cited.
Introduction
Methane (CH4) emission from ruminants is widely known as a threat to the environment and an economic loss. CH4 is the second most abundant greenhouse gas in the atmosphere and among the most potent greenhouse gases. CH4 also represents inefficiency of ruminant digestion as it represents a 2–12% loss of dietary energy depending on the feed (Johnson and Johnson, 1995).
McAllister and Newbold (2008) proposed a dietary strategy to mitigate CH4 emission from ruminants by redirecting the H2 utilization to short-chain fatty acid (SCFA) production. The strategy is to create competition for H2 utilization by adding a substrate that may act as an alternative H2 sink, such as fumarate or aspartate. Those compounds are precursors of propionate that naturally occurs in the rumen from carbohydrate digestion. Phloroglucinol (PHLO) is a phenolic compound that naturally occurs in the rumen as a product of rumen metabolism of tannins. Several rumen bacteria can degrade PHLO by using formate or H2for acetate production. This finding showed an opportunity to use PHLO as an alternative H2 sink agent. Previous in vivo studies showed that PHLO could redirect
Table 1: Composition of experimental in vitro batch cultures
| Material | Low Forage | High Forage | ||||
| Control | 6 mmol/L | 10 mmol/L | Control | 6 mmol/L | 10 mmol/L | |
| Inoculum (mL) | 50 | 50 | 50 | 50 | 50 | 50 |
| Rye grass hay (g) | 0.2 | 0.2 | 0.2 | 0.8 | 0.8 | 0.8 |
| Corn starch (g) | 0.45 | 0.45 | 0.45 | 0.15 | 0.15 | 0.15 |
| Wheat bran (g) | 0.35 | 0.35 | 0.35 | 0.05 | 0.05 | 0.05 |
| 1 M Phloroglucinol (mL) | - | 0.3 | 0.5 | - | 0.3 |
0.5 |
Table 2: Primers used in this study.
| Target | Name | Sequence (5′→ 3′) | Product size (bp) | Reference |
| Total bacteria |
1114-f 1275-r |
CGGCAACGAGCGCAACCC CCATTGTAGCACGTGTGTAGCC |
130 | (Abrar et al, 2016) |
| Ruminococcus albus |
Ra1281f Ra1439r |
CCCTAAAAGCAGTCTTAGTTCG CCTCCTTGCGGTTAGAACA |
175 | (Koike and Kobayashi, 2001) |
| Ruminococcus flavefaciens |
Rflf Rflr |
GGACGATAATGACGGTACTT GCAATCYGAACTGGGACAAT |
835 | (Tajima et al., 2001) |
| Fibrobacter succinogenes |
Fsf Fsr |
GGTATGGGATGAGCTTGC GCCTGCCCCTGAACTATC |
445 | (Tajima et al., 2001) |
| Methanogens |
q-mcrA-f q-mcrA-r |
TTCGGTGGATCDCARAGRGC GBARGTCGWAWCCGTAGAATCC |
140 | (Abrar et al, 2016) |
| Protozoa |
316f 539r |
GCTTTCGWTGGTAGTGTATT CTTGCCCTCYAATCGTWCT |
223 |
(Abrar et al, 2016b) |
the utilization of H2 to acetate production when CH4production was completely inhibited (Martinez-Fernandez et al., 2017). Hierholtzer et al. (2012) also reported that PHLO addition lowered CH4 production from anaerobically digested sludge obtained from wastewater treatment plants. However, the effect of PHLO on CH4 production, rumen fermentation, and microbial populations in mixed culture is not known.
CH4 formation in the rumen is directly related to feed characteristics, including the amount of H2 produced from its digestion (Janssen, 2010). Diet containing a high level of concentrate tends to produce less CH4 because starch digestion favors propionate production. Propionate formation is a H2 consuming reaction, which reduces the H2 available for CH4 production. However, a diet containing high levels of structural carbohydrates produces more acetate, which liberates H2 in the reaction (Valadares et al., 1999). Meanwhile, H2 is required by rumen microorganisms to reduce PHLO to acetate. Therefore, it is important to understand the effects of PHLO and different forage: concentrate (F:C) ratios on CH4 production, rumen fermentation, and microbial population in vitro. The aim of this study was to investigate the effects of PHLO and F:C ratios on CH4 production, rumen fermentation profiles, and microbial population in vitro.
Materials and Methods
Animal and Sampling
Rumen fluid was collected from three male Friesland sheep. The animals were given 800 g of Italian rye grass hay and 500 g of concentrate in a day. The concentrate consisted of wheat bran, corn, soy bean, and alfalfa, in a ratio of 1:1:1:1. The ration was divided into the same portion and given twice a day at 10:00 and 17:00. The animals were placed in individual cages. Water and a mineral block were offered ad libitum. Animal handling was performed according to the Mie University guidelines. The rumen fluid was collected by using a stomach tube just before the morning feeding. Collected rumen fluid was kept at 39°C during transportation to the laboratory.
In vitro Incubation
Pooled rumen fluid was filtered through four layers of surgical gauze. The filtered rumen fluid was diluted with McDougall buffer (McDougall, 1948), which was pre-flushed with N2 gas and pre-warmed to 39°C at a ratio of 2:1 (buffer:rumen fluid). The composition of each treatment is described in Table 1. The composition of the substrate was divided into two dietary treatment groups: low F:C diet and high F:C diet. The low F:C diet consisted of 20% rye grass hay and 80% concentrate to create an F:C ratio of 20:80. The high F:C diet consisted of 80% rye grass hay and 20% concentrate to create an F:C ratio of 80:20. Each substrate was finely ground by using a Wiley mill to pass through a 1 mm sieve. PHLO was prepared by dissolving it in pure ethanol to 1 M. Three different doses of PHLO (0, 6, and 10 mmol/L media) were added to empty serum bottles and were dried at 40°C overnight. After the ethanol was evaporated, substrates were weighed into the bottles accordingly. A sample of 50 mL of inoculum was added under N2 gas. The serum bottle was then tightly capped by using a rubber septum and an aluminum cap. The media was incubated for 24 h at 39°C using a shaking water bath at 180 rpm. Each treatment consisted of 3 bottles; 3 bottles of substrate only were used as the control group and 3 non-substrate bottles were used as a blank group and were also included in the incubation. The incubation was repeated 3 times for 3 separate days.
After 24 h, all bottles were put on ice to stop the fermentation. Total gas production was analyzed by measuring cumulative headspace gas using a glass syringe. The composition of the headspace gas was analyzed using a gas chromatograph (GC-8A; Shimadzu Corporation, Kyoto, Japan), as described by Matsui et al. (2013). After gas analysis was completed, the culture fluid was transferred to a 50mL centrifugation tube and was centrifuged at 1000 ×g for 5 min at 4°C to separate the residue and the culture fluid. A portion of the culture fluid was also transferred to a 5 mL centrifugation tube and stored at −30°C for quantification of the microbial population. After centrifugation, the culture fluid was transferred into a 2mL tube and kept at −30°C until analysis of SCFA and ammonia-N (NH3-N). Meanwhile, the constant weight of the residue was measured to determine dry matter digestibility. SCFAs in culture fluid were analyzed by high-performance liquid chromatography (HPLC), as described by Matsui et al. (2013). NH3-N in the fluid was determined using the phenol-hypochlorite method (Weatherburn, 1967). Molar amounts of SCFA and CH4 were used to calculate CH4 per total SCFA (CH4/SCFA). Molar amounts of CH4 were calculated by assuming an ideal gas constant of 0.082 at an air pressure of 1 atm and 20°C.
Metabolic Hydrogen [H] Calculation
A [2H] balance was calculated as described by Ungerfeld (2015) from the stoichiometry calculation of molar proportion of acetate, propionate, and butyrate. [2H]produced shows total amount of reducing equivalent pairs produced. [2H]incorporated, shows total amount of metabolic hydrogen incorporated into H2, CH4, propionate, and butyrate. [2H]recovery shows percentage of hydrogen produced recovered in CH4, propionate, butyrate, and H2 divided by [2H]produced.
Dna Extraction from the Rumen Fluid
Microbial DNA was extracted from ruminal fluid using a QIAamp DNA Stool Mini Kit according to the manufacturer’s instructions (Qiagen, Hilden, Germany). The extracted DNA was stored at −30°C until analysis.
Quantitation of the Microbial Population by Quantitative Real-Time Pcr
Primers (specific for Ruminococcus albus, Ruminococcus flaveciens, Fibrobacter succinogenes, methanogens, and protozoa) for real-time PCR are listed in Table 2. Real-time PCR was conducted using a StepOnePlus® Real-Time PCR System (Applied Biosystems, Foster City, CA, USA). Relative quantification of R. albus, R.flaveciens, F. succinogenes, and methanogens was performed using the comparative CTmethod. Absolute quantification of protozoa was performed using the standard curve method. Standard DNA was used to construct the standard curve that was prepared as described by Lwin et al. (2012).
CT of the 16S ribosomal RNA gene (16S rDNA) of total bacteria was quantified according to the method described by Abrar et al. (2016). CTof 16S rDNA of R. albus was quantified according to method described by Koike and Kobayashi (2001) with some modification. CTof 16S rDNA of R. flavefaciens and F. succinogenes was quantified according to the method described by Tajima et al. (2001), with some modification. Methanogens were quantified using a methanogen-specific gene, mcrA, following the method described by Abrar et al. (2016). The DNA copy number of 18S rRNA of protozoa was quantified following the method described by Abrar et al. (2016b).
Statistical Analysis
Data were subjected to a factorial analysis of variance (ANOVA) based on a randomized complete block design. The first factor was diets with different forage-to-concentrate ratios (low and high) and the second factor was doses of PHLO addition (0, 6, and 10 mmol/L). Different in vitro runs served as blocks in the ANOVA statistical model due to the variation of rumen microbial activity in each sampling period. An effect was considered significant at the probability level of P<0.05. Tukey’s test was conducted to compare differences among the treatments, either for the main effects or their interaction. Statistical analysis was conducted using IBM SPSS Statistics version 25.0 (SPSS Inc., Chicago, IL, USA).
Results
Effect of PHLO and F:C Ratio on CH4 Production and Rumen Fermentation Profiles
The data revealed that PHLO addition significantly lowered CH4 production in both diets (P<0.001; Table 3) in a dose-dependent manner. In the low F:C diet, CH4 was lowered by 18% by the addition of 10 mmol/L PHLO, meanwhile in the high F:C diet, CH4 was lowered by 32%. However, there was no significant effect of dietary treat
Table 3: Effect of phloroglucinol supplementation and F:C ratio on in vitro methanogenesis and rumen fermentation
|
Parameters
|
Low Forage:Concentrate Ratio | High Forage: Concentrate Ratio | SEM | P-value | ||||||
| 0 mmol/L | 6 mmol/L | 10 mmol/L | 0 mmol/L | 6 mmol/L | 10 mmol/L | F:C | PHLO | F:C × PHLO | ||
| Total gas production (mL) |
120.8c |
114.0bc |
110.9b |
94.6a |
95.0a |
91.6a |
1.7 | <0.001 | 0.002 | 0.067 |
|
CH4 production (mL) |
11.3cd |
10.0bc |
9.3b |
11.5d |
9.8b |
7.8a |
0.3 | 0.070 | <0.001 | 0.045 |
| Dry matter digestibility (%) |
64.4d |
63.0cd |
60.9c |
48.6b |
43.5a |
41.6a |
0.7 | <0.001 | <0.001 | 0.023 |
| pH |
5.94a |
5.96a |
5.97ab |
6.30d |
6.14c |
6.04b |
0.02 | <0.001 | <0.001 | <0.001 |
|
NH3-N (mg/dL) |
2.51a |
1.65b |
1.19bc |
0.72cd |
0.35d |
0.18d |
0.13 | <0.001 | <0.001 | 0.018 |
| Total SCFA (mmol/L) |
118.2d |
117.3cd |
107.6b |
99.9a |
110.2bc |
117.3cd |
1.7 | 0.001 | 0.031 | <0.001 |
| Acetate (mmol) |
3.193a |
3.047a |
2.967a |
3.160a |
3.596b |
3.890c |
0.086 | <0.001 | 0.001 | <0.001 |
| Propionate (mmol) |
1.974bc |
2.040c |
1.782b |
1.411a |
1.509a |
1.575a |
0.066 | <0.001 | 0.101 | 0.001 |
| Butyrate (mmol) |
0.746bc |
0.777c |
0.630b |
0.426a |
0.405a |
0.400a |
0.049 | <0.001 | 0.061 | 0.132 |
| Acetate : Propionate |
1.62a |
1.51a |
1.70a |
2.24b |
2.39b |
2.47c |
0.05 | <0.001 | 0.004 | 0.033 |
|
CH4 per Total SCFA (mol/mol) |
0.115b |
0.104ab |
0.112ab |
0.154c |
0.110ab |
0.079a |
0.008 | 0.533 | <0.001 |
<0.001 |
Values are means (n=9). SEM shows standard error of mean.Values followed by superscript letters within a row differ significantly (P≤0.05).
Table 4: Metabolic hydrogen balance.
| Parameters | Low Forage:Concentrate Ratio | High Forage:Concentrate Ratio | SEM | P-value | |||||||
| 0 mmol/L | 6 mmol/L | 10 mmol/L | 0 mmol/L | 6 mmol/L | 10 mmol/L | F:C | PHLO | F:C × PHLO | |||
|
[2H]produced(mmol) |
8.023a |
7.920ab |
6.931bc |
6.148c |
7.060abc |
7.704ab |
0.259 | 0.003 | 0.302 | <0.001 | |
|
[2H]incorporated(mmol) |
5.714a |
5.648a |
4.858b |
4.312c |
4.254c |
4.092c |
0.125 | <0.001 | <0.001 | 0.020 | |
|
[2H]recovery(%) |
72.092a |
71.832a |
70.361a |
71.626a |
60.587b |
53.108b |
1.971 | <0.001 | <0.001 |
<0.001 |
|
Values are means (n=9). SEM shows standard error of mean. Values followed by superscript letters within a row differ significantly (P≤0.05).
ments on CH4 production (P=0.070). The decrease of CH4 by PHLO was accompanied by the simultaneous decrease of total gas production, DMD, and NH3-N. Total gas production was lowered by 8% and 3% in low and high F:C diet with 10 mmol/L PHLO, respectively. Meanwhile, supplementation of 10 mmol/L PHLO lowered DMD by 5% in the low F:C diet and 14% in the high F:C diet. Addition of 10 mmol/L lowered NH3-N by 52% and 75% in low and high F:C diet, respectively. A low F:C diet resulted in significantly higher total gas production, DMD, and NH3-N than a high F:C diet (total gas production P<0.001; DMD P<0.001; NH3-N P<0.001). There was a significant effect of the dietary treatment on pH (P<0.001); pH of low F:C diet was lower than that of high F:C diet. The pH of high F:C diet was significantly lowered by addition of PHLO (P<0.001).
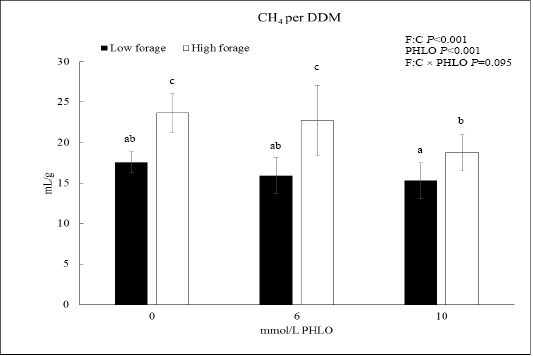
When CH4 was presented as CH4/DDM, the data showed that PHLO lowered CH4/DDM significantly along with a higher PHLO level (P<0.001; Figure 1). In low F:C diet, addition of 10 mmol/L PHLO lowered CH4/DDM by 13% meanwhile in the high F:C diet, CH4/DDM was lowered by 20%. The effect of dietary treatments was observed where CH4/DDM of high F:C diet was higher than that of low F:C diet (P<0.001).
PHLO addition significantly affected total SCFA production of both dietary treatments but in contrasting manner (P=0.031; Table 3). PHLO addition lowered total SCFA production of low F:C diet, and meanwhile, for high F:C diet, total SCFA production increased. Addition of 10 mmol/L PHLO lowered total SCFA production of low F:C diet by 9%, on the other hand, total SCFA production of high F:C diet increased by 17%. There was significant
Table 5: Relative quantity of rumen major cellulolytic bacteria and methanogens, and Protozoa population density expressed as 2-ΔΔCт.
| Microbial population | Low Forage: Concentrate Ratio | High Forage: Concentrate Ratio | SEM | P-value | ||||||
| 0 mmol/L | 6 mmol/L | 10 mmol/L | 0 mmol/L | 6 mmol/L |
10 mmol/L |
F:C | Phlo | F:C × Phlo | ||
| Ruminococcus albus |
1.000a |
0.395b |
0.197bc |
0.258bc |
0.163bc |
0.113c |
0.056 | <0.001 | <0.001 | <0.001 |
| Ruminococcus flaveciens |
1.000ab |
0.836a |
1.072ab |
1.557b |
1.455b |
0.862a |
0.136 | 0.006 | 0.081 | 0.006 |
| Fibrobacter succinogenes |
1.000a |
0.833a |
0.013a |
31.947b |
26.642b |
23.269b |
2.345 | <0.001 | 0.124 | 0.268 |
| Methanogens |
1.000a |
0.854a |
0.958a |
8.028a |
6.768b |
2.442b |
0.536 | <0.001 | <0.001 | <0.001 |
|
Protozoa* |
3.512a |
3.552ab |
3.213ab |
4.567c |
4.087bc |
4.110bc |
0.207 | <0.001 | 0.199 |
0.442 |
Values are means (n=9). SEM shows standard error of mean. Values followed by superscript letters within a row differ significantly (P≤0.05).
*Protozoa were quantified by the standard curve method. Values are expressed as log copy number/mL rumen fluid.
effect of dietary treatment on total SCFA production (P=0.001). Low F:C diet had higher total SCFA production than high F:C diet on all PHLO dose except for dose of 10 mmol/L PHLO where high F:C diet had higher total SCFA production than low F:C diet.
Changes in the production of individual SCFAs were also observed. PHLO addition significantly increased acetate production of high F:C diet but lowered the acetate production of low F:C diet (P=0.001). The addition of 10 mmol/L PHLO lowered acetate of low F:C diet by 7% and increased acetate production of high F:C diet by 23%.PHLO had a trend toward significant effect on propionate and butyrate production (propionate P=0.101; butyrate P=0.061). Propionate production of low F:C diet was lowered by PHLO meanwhile in case of the high F:C diet, propionate production increased. Propionate was lowered by 10% in low F:C diet but increased by 12% in high F:C diet by addition of 10 mmol/L PHLO. Meanwhile, addition of 10 mmol/L PHLO lowered butyrate production by 15% and 6% on low and high F:C diet, significantly. A significant effect of dietary treatment was observed where the proportion of acetate for the low F:C diet was lower than that of the high F:C diet (P<0.001); meanwhile, the proportions of propionate and butyrate of the low F:C diet were higher than those of the high F:C diet. PHLO addition significantly increased acetate: propionate ratio (P=0.004). Acetate: propionate ratio of low F:C diet were lower than that of high F:C diet (P<0.001).When CH4 was presented as CH4/total SCFA, A significant effect of PHLO addition was observed on CH4/total SCFA (P<0.001). Addition of 10 mmol/PHLO lowered CH4/total SCFA of low F:C diet by 3% and by 49% on high F:C diet, but there was no significant effect of dietary treatments on CH4/total SCFA
Effect Of Phlo And F:c Ratio on the Metabolic Hydrogen Balance
Table 4 shows the effects of PHLO and the F:C ratio on the metabolic hydrogen balance. There was a significant interaction effect of F:C + PHLO on [2H]produced (P<0.001). PHLO did not have any significant effects on [2H]produced(P=0.302). There was a significant effect of dietary treatments on [2H]produced (P=0.003). [2H]produced of low F:C diet were higher than that of the high F:C diet except at a PHLO dose of 10 mmol/L, where the [2H]produced of high F:C diet was ere higher than that of the low F:C diet.
There was a significant effect of PHLO addition on [2H]incorporated (P<0.001). 10 mmol/L PHLO lowered [2H]incorporated by 14% and 5% on low F:C diet and high F:C diet, respectively. The effects of dietary treatment were also observed where the [2H]incorporated of low F:C diet was higher than that of the high F:C diet. [2H]recovery of both diets was lowered with the supplementation of PHLO (P<0.001). 10 mmol/L PHLO lowered [2H]recovery by 2% and 26% on low F:C diet and high F:C diet, respectively. Dietary treatments significantly affected [2H]recovery(P<0.001) where [2H]recovery of low F:C diet were higher than that of high F:C diet.
The Effect of Phlo and F:c Ratio on Microbial Population Density
Table 5 shows the effects of PHLO and the F:C ratio on microbial population density. Real-time PCR data showed that PHLO addition significantly lowered relative quantity of R. albus and methanogens. However, there was no significant effect of PHLO on R. flaveciens, F. succinogenes, and protozoa. Dietary treatments significantly affected relative quantity of all measured microbial population. Relative quantity of R. flaveciens, F. succinogenes, methanogens, and protozoa on low F:C diet were lower than that of high F:C diet. On the other hand, relative quantity of R. albus on low F:C diet were higher than that of high F:C diet.
Discussion
PHLO addition in both diets significantly lowered CH4 production. This finding showed that PHLO has a similar effect on CH4 decrease, regardless of the F:C ratio of the diet. Our finding is in agreement with a report from Martinez-Fernandez et al. (2017) that showed PHLO could lower CH4 production more when supplemented in combination with chloroform than when chloroform was supplemented alone. Our study demonstrated that PHLO was able to lower CH4 production when supplemented alone and had similar effects in different F:C ratios.
PHLO significantly lowered the relative quantity of methanogens. Methanogens are the main actors in CH4 production in the rumen. Therefore, any decrease of the relative quantity of methanogens might partly explain the CH4 decrease by PHLO. Previous studies found that phenolic compounds are toxic to methanogens and could inhibit methanogen growth (Field and Lettinga, 1992, Tavendale et al., 2005).
PHLO might also indirectly lower CH4 production by lowering digestibility. The retardation of digestibility was indicated by the simultaneous decrease of DMD, total gas production, and NH3-N. Decrease of total gas production in both diets might indirectly indicate inhibition of carbohydrate digestion by PHLO. Lowered digestion of carbohydrate will result in less total gas production which may lead to less CH4 production. Phenolic compounds, such as PHLO, contain a free hydroxyl group (-OH) attached to a benzene ring. Free hydroxyl groups allow feed and phenolic compounds to form complexes through strong hydrogen bonds (Silanikove et al., 2001) and inhibit microbial digestion of fibre (McSweeney et al., 2001b). Phenolic compounds also might inhibit NH3-N through formation of complexes between its free hydroxyl group and the carbonyl groups of peptides on the protein (Silanikove et al., 2001). The complexes may inhibit the ruminal digestion of proteins through suppression of protease activity, microbial growth or activity, or by protection of the substrate protein (McSweeney et al., 2001b).
PHLO also lowered the relative quantity of R. albus. This finding might partially explain the retardation of digestibility by PHLO. R. albus is a predominant cellulolytic bacteria in the rumen (Chesson and Forsberg, 1997). In previous studies, polyphenolic compounds have been found to inhibit the population density of major cellulolytic bacteria in the rumen and lead to decrease on digestibility (McSweeney et al., 2001a, Jayanegara et al., 2015).
Total SCFA production, another indicator of carbohydrate digestion, showed a contradictory response to the addition of PHLO. Total SCFA production of low F:C diet was lowered by the addition of PHLO, but in high F:C diet, PHLO addition increased total SCFA production. This finding might be related to change in individual SCFAs, particularly acetate and propionate production. Addition of PHLO lowered acetate and propionate production of low F:C diet but increased SCFAs production of high F:C diet. In high F:C diet, addition of 10 mmol/L PHLO increased acetate production by 0.73 mmol which is lower than predicted increase of acetate by addition of PHLO (1 mmol) (1 molecule PHLO + 1 molecule H2= 2 molecule acetate + 2 molecule CO2(Tsai et al., 1976). However, in the low F:C diet, acetate production was lowered by 0.23 mmol. This finding shows that in high F:C diet, PHLO might redirect rumen fermentation toward acetate production but in low F:C diet, PHLO did not redirect rumen fermentation but only inhibited rumen fermentation. This finding might also show that PHLO addition might lower CH4 production by lowering digestibility and/or redirect rumen fermentation from CH4 towards acetate depending on the diets. Previous studies had shown that rumen microorganisms could metabolize PHLO to acetate by using H2 or formate as a reducing agent (Tsai et al., 1976). Patel et al. (1981) reported that Coprococcus spp. reduce PHLO to dihydrophloroglucinol using NADPH. Martinez-Fernandez et al. (2017) further found that PHLO addition increased acetate production with lower H2 expelled per mole of CH4 decreased and formate concentration in the rumen.
Increasing acetate production in high F:C diet might also indicate that part of the CH4decrease was because the H2 utilization was redirected to SCFA production. This finding was complemented with simultaneous reduction of CH4/total SCFA. Reduction of CH4/total SCFA suggests that the level of CH4 production can be lowered by PHLO without lowering the amount of energy available to the ruminant in the form of SCFA. Our finding was in agreement with in vitro studies (Jayanegara et al., 2012) which had shown that phenolic compound addition lower CH4/total SCFA. Lowered CH4/total SCFA showed fermentative productivity of the rumen, which might occur when an alternative H2 sink is available. Our findings suggest that in the high F:C diet, PHLO might acts as an H2 sink, redirecting H2 utilization and reducing CH4production. PHLO can be degraded by several rumen bacteria, mainly by those of the genus Coprococcus and Eubacterium by using H2 or formate resulting in acetate (Tsai et al., 1976, Krumholz and Bryant, 1986). Supplementation of PHLO in the rumen may stimulate an increase in the number of Coprococcus (Martinez-Fernandez et al., 2017) that can use H2 for PHLO degradation resulting in greater acetate production and leading to H2 scarcity for methanogen to produce CH4.
The calculation of [H] balance showed that [2H]incorporated and [2H]recovery were lowered by PHLO addition despite the significant increase of acetate in high F:C diet that may indicate a possible redirection of H2 to acetate.A possible explanation is that the formula used in the calculation does not account for the acetate produced through reductive processes, such as the reduction of PHLO. The finding was in agreement with a study by Ungerfeld (2015), which found that the [2H]recovery was lowered when methanogenesis was inhibited. The author further stated that the formula used to calculate the hydrogen balance did not include [H] sink other than main fermentation products such as propionate, butyrate, and H2when methanogenesis is inhibited. This would include redirection of [H] to acetate by PHLO supplementation.
In conclusion, PHLO could decrease CH4 production in different F:C ratios when supplemented alone. The decrease was related to the reduction of methanogen number and nutrient digestibility. Depending on the diet, PHLO could also lower CH4 by redirecting H2 utilization from CH4 production to acetate production.
Acknowledgements
Real-time PCR was carried out at The Life Science Research Center (Center for Molecular Biology and Genetics), Mie University (Tsu, Japan). We would like to thank Hani Sukmawati and Budi Wardiman for their assistance in collecting ruminal fluid.
conflict of interest
The authors certify that there is no conflict of interest with any financial organization regarding the material discussed in the manuscript.
authors contribution
All authors conceived and design analysis. KAS collected data and perform analysis. KAS, AJ, HM performed statistical analysis. All authors write the manuscript and agree to be accountable for all aspects of the work.
References


