Advances in Animal and Veterinary Sciences
Research Article

Genetic Parameter for Growth Performance of Saburai Goat in Tanggamus District, Lampung Province, Indonesia
Sulastri Sulastri, Siswanto Siswanto, Kusuma Adhianto*
Animal Science Department, Faculty of Agriculture, University of Lampung, Jl Sumantri Brojonegoro no 1 Bandarlampung, Lampung, Indonesia, 35145.
Abstract | Saburai goat was local name crossbred Boer buck and Ettawa grade goat does. The main objectives of this study were to estimate heritability (h2), repeatability (r), and genetic correlation (rg) among body measurements and body weight. Survey method were used to collect data 150 progenies. Variables observed at birth, weaning and yearling were body weight (BW, WW,YW) body measurement, body height (BBH, WBH, YBH), body length (BBL, WBL, YBL), chest circumference (BCC, WCC, YCC), hip height (BHH, WHH, YHH), ear length (BEL, WEL, YEL), and ear width (BEW, WEW, YEW). The result indicated that h2 for performance at birth that was lowest were BEW (0.07±0.02) and the highest were BHH (0.14±0.05), at weaning that was lowest were WEW (0.07±0.01), the highest were WCC (0.17±0.00) and WHH (0.17±0.00), at yearling that were lowest were YEL (0.09±0,01) and YEW (0,09±0,02), the highest were YHH (0,19±0,06). Repeatability at birth that was lowest were BEL (0.10±0.02), the highest were BBH(0.16±0.01) and BHH(0.16±0.03), at weaning that was lowest were WEL (0.12±0.02) and WEW (0.12 ±0.04), the highest were WBL (0.19±0.03), at yearling that was lowest were YEW (0.14±0.03), the highest were YBH (0.22±0.09) and YBL (0.22±0.08). Genetic correlation at birth that was lowest were between BBW and BEW (0.08±0.01), the highest between BBW and BCC (0.14±0.07), rg at weaning that was lowest were between WBW and WEW(0.10±0.03), the highest were between WBW and WCC (0.21±0.08), rg at yearling that was lowest were between YBW and YEW (0.08±0.01), the highest between YBW and YBL (0.19±0.08), between YBW and YCC (0.19±0.07), between YBW and YHH (0.19±0.09). It could be concluded that body measurement can be used as selection criteria to increase body weight.
Keywords | Saburai goat, Heritability, Repeatability, Genetic correlation, Body measurement
Editor | Kuldeep Dhama, Indian Veterinary Research Institute, Uttar Pradesh, India.
Received | July 28, 2018; Accepted | August 31, 2018; Published | September 26, 2018
*Correspondence | Kusuma Adhianto, Animal Science Department, Faculty of Agriculture, University of Lampung, Jl Sumantri Brojonegoro no 1 Bandarlampung, Lampung, Indonesia, 35145; Email: kusuma.adhianto@fp.unila.ac.id
Citation | Sulastri S, Siswanto S, Adhianto K (2018). Genetic parameter for growth performance of saburai goat in tanggamus district, lampung province, indonesia Adv. Anim. Vet. Sci. 6(11): 486-491.
DOI | http://dx.doi.org/10.17582/journal.aavs/2018/6.11.486.491
ISSN (Online) | 2307-8316; ISSN (Print) | 2309-3331
Copyright © 2018 Sulastri et al. This is an open access article distributed under the Creative Commons Attribution License, which permits unrestricted use, distribution, and reproduction in any medium, provided the original work is properly cited.
INTRODUCTION
Goats are widely spread in Lampung Province due to its function as animal importance, subsistence, economic and social livelihoods. EGG was one of some goat breed at Lampung however its growth performance were low (yearling weight not more than 40 kg). Grading up program between Boer buck and EGG goat to create goat which was high growth performance. Since the program was begun in 2002 until now the improvement of growth performance of Saburai was not high as prediction (Sulastri and Adhianto, 2016).
Saburai goat was crossbred between Boer buck and Ettawa grade goat (EGG) does. Saburai does would be crossed to Boer buck to result Saburai goat in the grading up program of Boer buck and EGG does. The grading up program was conducted to create Boer grade goat (Saburai goat). Saburai goat will be improved at Tanggamus regency, Lampung Province Indonesia as meat goat. Some Boer buck was introduced to Lampung for conducting the program. The success of introducing specialized breeds depends also on high survival rates that are essential for replacement of old stock, effectiveness of selection, reduction of costs and increased productive performance.
In the grading up program, Saburai does should be selected before being crossed to Boer buck to obtain growth performance of Saburai grade goat which was high and over than its parents. Up to now, no selection for the Saburai does, therefore yearling weight of Saburai grade goat had not obtain more than 40 kg. Export market just received goats from Indonesia which has yearling weight more than 40 kg (Shipley and Shipley, 2005).
Weight body at certain age were important components influencing the profitability of goat and important objectives in selection strategies. Selection would be success when genetic variance of traits were medium up to high; Estimates of heritability for growth traits related to growth are needed to develop a proper selection program. Birth weight, weaning weight and yearling weight were undoubtedly the most important traits in goat production (Devendra and Burns, 1994).
Body weight at certain age associated each other due to genetic correlation in that traits. Selection in one traits would improve the other traits correlated genetically. Nevertheless, genetic correlation could predict the improvement the other traits (Falconer and Mackay, 1996). Therefore, The main objectives of this study were to estimate (heritability (h2), repeatability (r), and genetic correlation (rg) among body measurements and body weight. The information would be useful to determine criteria of selection for improvement growth traits of Saburai goats.
MATERIALS AND METHODS
Data Collection and Statistical Analysis
The study was conducted from January to August 2017. Recording of Saburai growth traits raised at the Saburai Goat Breeding Village Centre at Dadapan village, Sumberrejo subdistrict, Tanggamus regency(5.3027° S, 104.5655° E), Lampung province were used as materials in this research. Survey method were conducted to collect data of growth traits obtained from recording of growth traits. The growth traits observed were body weight and body measurements. Data of body weight included in this research were birth weight (BW), weaning weight (WW), yearling weight (YW). Data of body measurements observed consisted of body length (BL), body height (BH), chest depth (CD), chest width (CW), hip height (HH), ear length (EL), ear width (EW) at birth (B), weaning (W), yearling (Y). Recording for growth traits and body measurements of 150 progeny of 9 bucks were collected to estimate heritability value and genetic parameters by one way lay out method.
Analysis Data
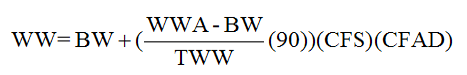
Correcting Data: Data of BW were corrected on sex of individuals, WW on sex, age of dam, and weaning time (days), YW on sex and weaning. The formulas to correct data of BW, WW, and YW as follows (Sulastri, 2014).
BW= (BWA)(CFS)
YW=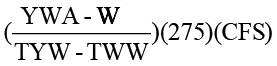
Explaination:
|
BW |
=Birth weight corrected |
|
BWA |
=Birth weight actual |
|
CFS |
=Correction factor for sex |
|
WW |
=Weaning weight corrected |
|
WWA |
=Weaning weight actual |
|
TWW |
=Time to get weaning weight (days) |
|
CFAD |
=Correction factor for age of dam |
|
YW |
=Yearling weight corrected |
|
YWA |
=Yearling weight actual |
|
TYW |
=Time toget yearling weight actual |
Correction factor for sex (CFS) was obtained as follows:
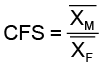 (
( =average of male goat BW,
  = average of female goats BW ). The CFS were used to calculate BW of female goats.
Heritability Estimation
Data corrected had been analyzed to estimate heritability parameter by analyses for variance of one way lay out method. Mathematic model of the analysis as recommended by Becker (1992),  (Yik=mean,
  =effect of bucks ith,
  =genetic and environment deviation affect individual in buck group. Analysis of variance presented in Table 1.
Heritability value were calculated by formula: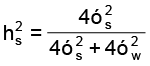
Standard error were calculated by formula: 
t =intraclass correlation

Table 1: Analyse of variance to estimate heritability
| Source of variance | Degree of freedom | Sum of square | Mean square | Component of variance |
|
Between bucks |
s-1 |
SSS |
MSS |
|
| Between progeny within bucks | n.-s |
SSW |
MSW |
|

Explanation:
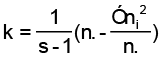
s= number of bucks;  = number of progeny in bucks; ith= number of does mated to bucks ith; k =coeffisien=
 ; n. =number of individual;
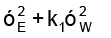
  =component of variance between bucks;
  =component of variance between individuals within bucks
Repeatability Estimation
Data corrected had been analysed repeatability by intraclass correlation methof recommended by Becker (1992). The mathematic model were Ykm=µ+αk+ekm (µ is the common mean, αk is the effect of the k-th individual and ekm is the environmental deviation of m-th measurement within an individual. All effects are random, normal, and independent with expactations equal to zero in Table 2.
Repeatability was estimated by formula as follows:
R=
Standard error of R is the square root of sampling variance of the intraclass correlation, R as recommended by Becker (1992):
The formula of sum of square (SS) were :
SSW = 
SSE = 
The formula of Mean Square were :
MSW = SSW/ (n – 1)
MSE = SSE / n(m – 1)
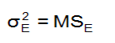
Component of variance and formula of repeatability (r) were :
 = MSE
= MSE
r =
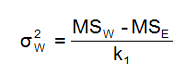
 = (MSW – MSE) / k1
The formula of standar error for repeatability (r) :
S.E. (r) = 
Table 2: Analyse of variance to estimate repeatality
| Source | d.f. | SS | MS | Component of variance |
|
Between individuals |
N-1 |
SSW |
MSW |
|
| Between measurements , within individuals | N(M-1) |
SSE |
MSE |
|

N=number of individuals (number of does); M=number of measurements per individual (per doe); equal number for each individual; k1=M
If the number of measurements per doe were anequal, k1 was computed by formula as follows:
k1 = 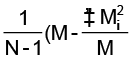 )
)
Genetic Correlation
Data corrected had been analyzed to estimate genetic correlation by analyses of covariance of one way lay out method parameter . Mathematic model of the analysis as recommended by Becker (1992), (Yik=mean, =effect of bucks ith, =genetic and environment deviation affect individual in buck group. Analysis of covariance presented in Table 3.
The formula of genetic correlation (rG) were:
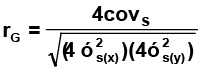
n..=total number of individual
The formula of standard error (S.E.) for genetic correlation (rG) was:

Table 3: Analyses covariance to estimate genetic correlation
| Source of variance | Degree of freedom | Sum of cross product | Mean of cross product | Component of covariance |
|
Between bucks |
s-1 |
SCPs |
MCPs |
Covw+kcovs |
| Between progeny within bucks |
n-s |
SCPw |
MCPw |
Covw |
Explanation:
Covs= component of covariance between traits correlated with bucks; Covw= component of covariance between traits of individual within bucks
Table 4: Coefficient for genetic correlation in one way lay out method
| Korelasi | Koefisien | ||
| L | A | B | |
|
rG |
K | 1 | 1 |
|
rE |
K | 3 | k+3 |
|
rP |
K | 3 |
k+3 |
Explaination:
rG = genetic correlation; rE = environment correlation; rP = phenotypic correlations
RESULTS AND DISCUSSION
from the results of the study found that the genetic parameters will increase, in accordance with the development of age
Heritability for Growth Traits
Result of this research indicated that heritability growth traits at birth, weaning, and yearling were mediumup to high except EL0, EW0 and EL12that were low. Heritability EL3, EW3, and EW12 were medium (Table 1) . Heritability were classified low and medium when thevalue 0,00 up to 0,10 and>0,10 up to 0,20, respectively (Hardjosubroto, 1994). Ear length and ear width were not effective to be improved by selection however important as qualitative character of breed. One character of Saburai were ear length and ear width from EGG although not as high as EGG.
Heritability of growth traits at birth were medium however not more than that at weaning and yearling. Variance of genetic for growth trait at birth were low due to selection process internally began fertilization, growth process as foetus up to be born as kid. Besides that, selection to improve growth traits at birth implicated to dystocia. Heritability of growth traits at birth generally low (Hardjosubroto, 1994) due to the traits were determined not only by genetic potential but also by maternal and environmental factors (Mandal et al., 2006).
Heritability for BW0in this research were lower than that was resulted in Saburai goats at Campang village, Gisting subdistrict, Tanggamus regency, 0.80±0.40 in BW0 (Beyleto et al., 2012). Some results of research about heritability varied depend on genetic variance of population, method of estimation, and breed. Heritability of BW0 in Boerka goat (Boer buck><Kacang doe) 0.23±0.15 and in Boerka (Kacang buck><Boer doe) 0.09±0.14 (Elieser, 2012), 0.34 in Boer goat (Els, 1999), 0.19±0.08 for BW0, 0.14±0.07 for BL0, 0.24±0.89 for BH0, 0.25±0.10 for CG0in Boer goats (Zhang et al., 2008), 0.17±0.07 for BW0 in Boer goats (Zhang et al., 2009), 0.178±0.044 for BW0 in Adelaide Boer (Niekerk et al., 1996).
In Black Bengal goats, heritability for BW0, BW3 and BW12were 0.05, 0.28, 0.18 (Faruque et al., 2010), although there were different in heritability BW12. Heritability of three breed in one population (Saanen, Bornova, Saanen><Killis goat) for BW0 were 0.43±0.11 (Kosum et al., 2004), 0.20 in Sicilian Girgentana goat (Portolano et al., 2002), 0.80 in Emirati goat (Al Shorepy et al., 2002),
Heritability of weaning and yearling traits (except ear length and ear width) were effective to improve growth traits. Weaning traits and yearling traits could be used as criteria of selection to determine replacement stock. However, that criteria was not as accurate as yearling weight because in weaning weight still included maternal effect (Mandal et al., 2006) and in yearling weight didn’t so. The maternal genetic effect seems to do not affect the late growth (Zhang et al., 2009).
Heritability for BW3 resulted in this research (0,24±0,08) were similarly with the other research for the same traits, 0.30±0.17 in Saburai goats, 0.18±0.20 in Boerka crossbred between Kacang buck><Boer doe, 0.24±0.17 in Boerka crossbred between Boer buck><Kacang doe, 0.30±0.17 in Saburai goat (Beyleto et al., 2010), 0.051±0.079 in Boer goats (Kosum et al., 2004), 0.60 in Boer goats (Els, 1999),0.22±0.08 in Boer goat (Zhang et al., 2009)., 0.28 in Black Bengal goats (Faruque et al., 2010). 0.19 in West African Dwarf goats (Ayizanga, 2009)
Heritability for BW12in this research 0.29±0.17 that was differ with heritability for BW300(0.10±0.08) in Boer goats (Zhang et al., 2009), 0.80±0.40 in Saburai goat (Beyleto et al., 2010), 0.38±0.34 in Boerka crossbred between Kacang buck and Boer doe, 0.31±0.21 in Boeka crossbred between Boer buck and Kacang doe (Elieser, 2012), 0.21±0.25±0.22 in West African Dwarf goats (Ayizanga, 2009)
Repeatability for Growth Traits
Repeatability for growth traits were medium up to high except EW0 (0,10±0,03) that was low, that indicated most of variance of phenotypic for those traits due to variance of genetic and variance of permanent environment. This research was similar with the other research, Repeatability for birth weight and weaning weights of Teddy goat were 0.2089 ± 0.0315 and 0.1381 ± 0.0315, respectively. The moderate estimates indicate that selection on the basis of first record will be effective to improve birth weight. But the low estimates for weaning weight indicate that selection should be based on multiple records (Tahir et al., 1994).
Repeatability for growth traits of Saburai goat at Campang village, Gisting subdistrict, Tanggamus regency, Lampung Province was high. Repeatability of BW0, BW3, and BW12 estimated by intraclass correlation method were 0.80±0.22, 0.70±0.33, 0.30±0.10, respectively and by interclass correlation were 0.42±0.07, 0.32±0.08, 0.30±0.08, respectively (Beyleto et al., 2010), that of Boer goats were 0.17±0.07, 0.22±0.08, 0.10±0.08, respectively (Zhang et al., 2009), for BW0 and BW3 of Boerka goats by interclass correlation method were 0.29±0.14 and 0.25±0.21, of Boer goats were 0.48±0.16 and 0.45±0.20, of Kacang goat were 0.44±0.002 and 0.30±0.01 (Elieser, 2012). Repeatability of performance that was medium up to high indicated that that of progeny of does selected could be predicted higher than their does (Falconer and Mackay, 1996).
Genetic Correlation
Result of this research indicated that genetic correlation between BW0 and body measurements at birth, between, BW3 and body measurements at weaning, between BW12 and body measurements at yearling, among BW0, BW3, and BW12 were positive and ranges medium up to high, except between BW0 and EL0 (0.10±0.00), BW0 and EW0(0.09±0.00). That result mean that selection to improve BW could be done using body measurements as criteria of selection. Besides that, selection to improve BW12 could be done using BW0 and BW3 as criteria of selection.
In crossbred (F1) between Boer and local Indonesian goat, the genetic correlation value between weaning weight and body length was 0.81 ± 0.4 (high positive), weaning weight and chest girth was 0.47 ± 0.77 (moderate positive) and weaning weight and wither height was 0.14 ± 0.55 (low positive). It was concluded that weaning weight has strong genetic relation with body length, which means that selection based on body length would give correlated response to weaning weight (Rosahastuti, 2008).
Genetic correlation between BW0 and BW12, BW3 and BW12 of Saburai goats at Campang village, Gisting sundistrict, Tanggamus regency, Lampung Province were 0,50±0,04, 0,44±0,08, 0,21±0,03, respectively (Beyleto et al., 2010). Genetic correlation for BW3 and BW6, BW3 and BW12, and BW6 and BW12of Boerka crossbred (Boer bucks><Kacang does) were 0.64±0.29, 0.23±0.28, 0.70±0.26, respectively (Elieser, 2012).
Conclusion
In conclusion, improvement for growth traits of Saburai goats was properly conducted by mass selection and body measurement could be used as criteria for selection to improve body weight.
Acknowledgements
We would like to thank the Ministry of Research and Higher Education who financed this research through the Penelitian Dasar Unggulan Perguruan Tinggi Fund research scheme with number 8592/UN26.21/KU/2017 in 2017.
authors contribution
Sulastri: Animal work, sample collection, and manuscript preparation.
Siswanto: Sample collection, serum biochemical parameters analysis, and manuscript preparation.
Kusuma Adhianto: Designing the experiment, animal work, manuscript preparation, and publishing the article “corresponding author”.
REFERENCES


