South Asian Journal of Life Sciences
Research Article
S. Asian J. Life Sci. 6(1): 1-6
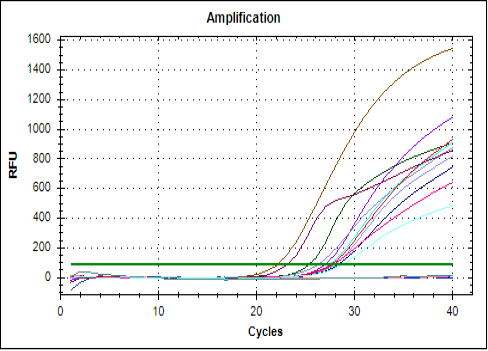
Figure 1
RT PCR DNA Amplification; The positive control quantified at 19 cycles .The graph represents the quantification cycles of samples with respect to positive and negative control .The earlier the quantification cycle comes the more is the infection.
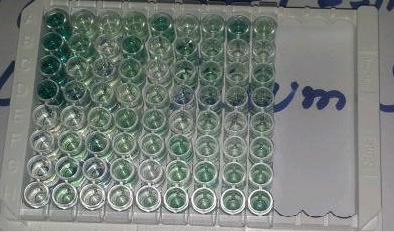
Figure 2
i-ELISA; The first four wells represent the positive control and the later represents the negative control, the intensity of the colour shows the titer of antibodies.
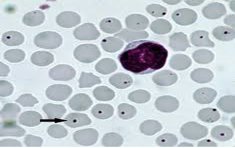
Figure 3
Anaplasma marginale visibility in Microscopy


