Journal of Infection and Molecular Biology
Research Article
J. Inf. Mol. Biol. 3 (3): 75 - 80
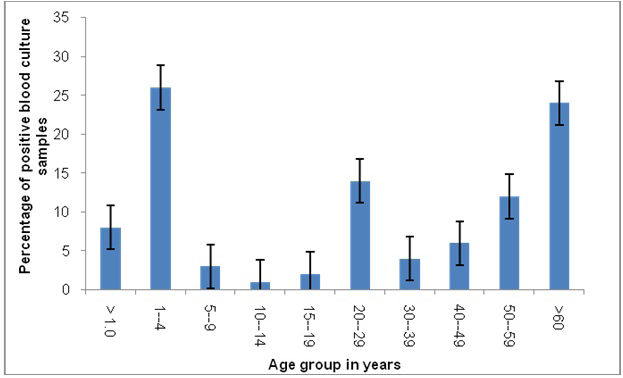
Figure 1
Percentage of positive blood culture samples in different age groups
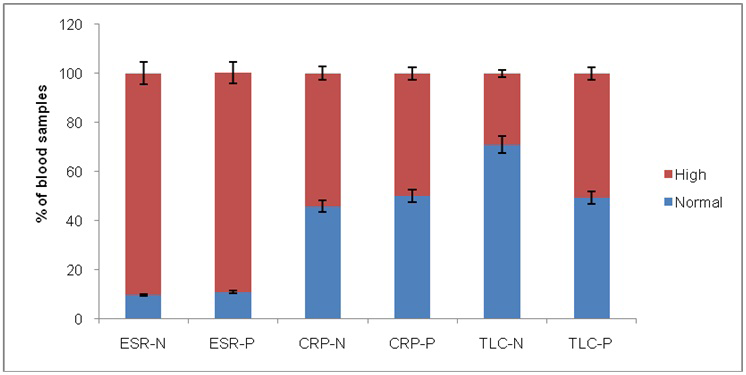
Figure 2
Bar chart showing the percentage of normal and high ESR, CRP and TLC values in positive and negative blood samples


