Journal of Animal Health and Production
Research Article

Surveillance of Milk Adulteration and its Influence on Physico-Chemical Characteristics of Milk in Hyderabad, Pakistan
Muhammad Awais Memon*, Muhammad Khaskheli, Asghar Ali Kamboh, Naeem Aziz Soomro, Abdul Samad Mangsi, Ghulam Shabir Barham, Nazar Ali Korejo
Department of Veterinary Pathology, Veterinary College and Research Institute, Namakkal, India.
Abstract | Present study was carried out to evaluate the common adultrants practiced in market milk at the vicinity of Hyderabad city. In first experiment, a total of 100 unprocesed milk samples (five from each retailer sale points) were collected and examined during the summer season. Market milk was mainly adulterated with water, formalin, cane sugar (CS), skimmed milk powder (SMP), starch and sodium chloride. The water was common adulterants found to be in all the milk samples (100%), followed by formalin (34%), CS (24%), starch (13%), SMP (08%) and sodium chloride (05%). In second experiment, the recovered adultrants (viz., water, starch, SMP, CS, formalin) was used as treatment to record their effects on the physico-chmical charcateristics of normal milk. Significant influence of extraneous water (10 and 20% ) among the treatment was observed on physico-chemical characteristics of milk. Decrease in specific gravity (1.027±0.0003 and 1.024±0.001 respectively) and increase in freezing point(-0.462±0.01 and -0.399±0.010C, respectively) was recorded against their corresponding controls (1.030±0.001 and -0.525±0.010C, respectively) by the addition of extrenous water in milk. Addition of 10% water did not show any significant influence (p> 0.05) on pH value of milk (6.68±0.03), while 20% water had remarkable effect (p<0.05) on it (6.72±0.02) compared to that of whole milk (6.64±0.02). comparable reduction (p<0.05) in TS (total solid) content (13.34±0.28 and 11.15±0.44%) as compared to control milk (15.54±0.35) was observed. Protein, fat and lactose contents were also influenced (p<0.05) by addition of extraneous water to control milk. Addition of 1 and 2% each of starch, SMP and CS to normal milk did not show (p> 0.05) any significant influence on pH values and fat contents of milk, except addition of 2% CS that affected the pH (p<0.05). These results indicate alarming state of milk adulteration in Hyderabad city. As these adultrants significantlty affected the physico-chemical characteristics of milk like specific gravity, total solids content, protein and lactose content of milk.
Keywords | Milk, Adulteration, Physico-chemical characteristics, Hyderabad, Water
Editor | Asghar Ali Kamboh, Sindh Agriculture University, Tandojam, Pakistan.
Received | February 05, 2018; Accepted | March 01, 2018; Published | March 20, 2018
*Correspondence | Muhammad Awais Memon, Faculty of Animal Husbandry and Veterinary Sciences, Sindh Agriculture University, Tandojam 70060, Pakistan; Email: drmemonawais@gmail.com
Citation | Memon MA, Khaskheli M, Kamboh AA, Soomro NA, Mangsi AS, Barham GS, Korejo NA (2018). Surveillance of milk adulteration and its influence on physico-chemical characteristics of milk in Hyderabad, Pakistan. A Review. J. Anim. Health Prod. 6(1): 5-12.
DOI | http://dx.doi.org/10.17582/journal.jahp/2018/6.1.5.12
ISSN (Online) | 2308-2801; ISSN (Print) | 2309-3331
Copyright © 2018 Memon et al. This is an open access article distributed under the Creative Commons Attribution License, which permits unrestricted use, distribution, and reproduction in any medium, provided the original work is properly cited.
Introduction
Milk has been a food source for humans since prehistoric times. It is highly nutritious containing essential nutrients like, energy providing lactose and fat, the bone forming calcium and other minerals, the body building proteins and health promoting vitamins required for the development of all age groups (Hoppe et al., 2006).
Regardless Pakistan is the fourth largest milk producing country in the world after the united state, Russia, and India (Farooq, 2011), the major quantity of milk is sold as raw on traditional system (Lateef et al., 2009). Unfortunately, due to unorganized and non-regulated marketing systems, the quality of milk is hardly maintained at consumer level (Javaid et al., 2009). It has been observed that adulteration of milk is one of the most serious issues that the dairy sector of Pakistan is today facing, causing not only major economic losses for the processing industry, but also a major health risk for the consumers. Due to the spread of small holding farmers and consequent supply chain complexities, milk handling processes in the traditional system are extremely unhygienic and there is no enforcement of standards, so the result is poor quality products. In order to keep milk temporarily fresh, middlemen commonly add ice to the milk, which results in dilution of milk solids. Compounding the problem, middlemen attempt to counter the dilution by adding vegetable oil, starch, flour, sugarcane, whey powder, skim milk powder, and other ingredients to extend the solid content of the milk (Fakhar et al., 2006). Besides, some adulterants like detergent are used to enhance the cosmetic nature of milk. When water is added in milk, its foamy appearance diminishes, so to give milk a foamy appearance artificially detergents are added in it. Hair removing powders (calcium thioglycolate/potassium thioglycolate/calcium salts of thiogycolic acid) and urea are added for whitening of milk and giving it genuine look. Only few grams of urea is enough to bring milk in its original state (Walker et al., 2004).
The adulteration of milk may cause significant problems for human health for example; the milk adulterated with contaminated water is a serious health hazard because of potential waterborne diseases (Leghari et al., 2017; Pirzada et al., 2016). Other adultrants like, urea, caustic soda, formaline, hydrogen peroxide, starch, boric acid etc., in milk can cause food poisoning, vomiting, nausea, hypertension, aging, as well as heart, liver and kidney diseases (Ayub et al., 2007; Butt, 2011; Clare et al., 2003; Rideout et al., 2008; See et al., 2010). Feeling gravity of problem, present work has been designed to investigate the common adulterations practiced in market milk of Hyderabad city, and also influence of those adulterations on physico- chemical characteristics of milk.
Materials and methods
Collection of Milk Samples
In this study, a total of 20 milk retailer points were randomly selected at the vicinity of Hyderabad city. From the retail points, a total of 100 unprocesed milk samples (five from each retailer sale points) were collected for observing the extent of adulteration. All possible precautions were taken to avoid external contamination at the time of collection of the samples.
Whole buffalo milk obtained from Livestock Experiment Station, Department of Livestock Management, Faculty of Animal Husbandry and Veterinary Sciences, Sindh Agriculture University Tandojam was used as control samples for comparison purpose.
Analysis of Adulterants in Market Milk
As soon as milk samples received at the laboratory, those were screened for various adulterants like thickening agent, chemical preservatives, constitutional adulterants and neutralizing agents using the milk adulteration testing kit (UVAS, Lahore). Whereas presence of extraneous water in market milk was determined according to the method of Association of Official Analytical Chemists (AOAC, 2000). The presence of skimmed milk powder in market milk was analyzed accroding to methods reported by Khaskheli (2010).
Impact of Adulterants on Physico-Chemical Characteristics of Market Milk
In the second experiment, the impact of adulterants detected such as water, starch, skimmed milk powder (SMP), cane sugar (CS) and formalin on the physico-chemical characteristics was examined. Whole milk samples divided into ten parts were grouped into A, B, C, D, E, F, G, H and I. Each group was again sub-grouped as B1and B2, C1 and C2, D1 and D2, E1 and E2, F1 and F2, G1 and G2, H1 and H2 and I1 and I2 except group A (control). Sub group B1 and B2 was added with 10 and 20% water, C1 and C2 with starch 1 and 2%, D1 and D2 with starch + water 1:10 and 2:10%, E1 and E2 with SMP 1 and 2%, F1 and F2 with SMP + water 1:10 and 2:10%, G1 and G2 with cane sugar, 1 and 2%, H1 and H2 with cane sugar + water 1:10 and 2:10%, , I1 and I2 with formalin 0.1 and 0.2%, respectively. The experiment was designed with six replications and in each replicate, all the samples were analyzed for physico-chemical characteristics such as pH, specific gravity, viscosity, freezing point, protein, fat, moisture/total solids content, solids not fat, lactose and ash contents. The pH values of milk were recorded using pH meter (Model Hl, Hanna Instruments, Italy). Protein content was determined according to the method of British Standards Institution (BSI, 1990). Specific gravity, freezing point, moisture/total solids content and ash content of milk were determined according to the method of Association of Official Analytical Chemists (AOAC, 2000). Fat content was determined by Gerber method as described by James (1995). Lactose content was determined according to procedure of Khaskheli (2010).
Statistical Analysis
The data obtained was tabulated and analyzed according to statistical procedure of analysis of variance (ANOVA), and in case of the significant differences exist, the means were further computed using least significant difference (LSD) at 5% level of probability through computerized statistical package i.e. Student Edition of Statistix (SXW), Version 8.1 (Copyright 2005, Analytical Software, USA).
Results
Common Adulterants Observed in Market Milk Samples
Market milk samples randomly obtained from different areas of Hyderabad city were examined for adulteration, and results are illustrated in Figure 1. No any sample was found to be wholesome / unadulterated among all the milk samples analyzed for adulteration. Milk was mainly adulterated with water, formalin, cane sugar, skimmed milk powder, starch and sodium chloride. The water was common adulterants found to be in all the milk samples (100%) evaluated under present study. While formalin was another adulterant detected in 34% of milk samples from a total of 100 samples. Further, among 100 milk samples, 24% were positive for cane sugar, followed by 13% for starch, 08% for skimmed milk powder and 05% for sodium chloride. However, adulterants like urea, detergent, boric acid, hydrogen peroxide, sorbitol, carbonate, hypochlorite and quaternary ammonium compounds (QAC) were not detected and thus not shown in Figure 1.
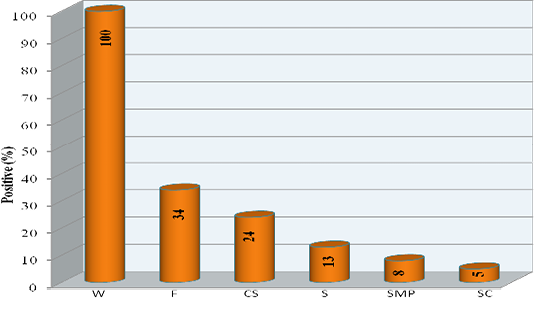
Figure 1: Positive percent of various adulterants detected in market milk samples of Hyderabad city. W= Water, F = Formalin, CS = Cane sugar, S= Starch, SMP= Skimmed milk powder, SC = Sodium chloride
Positive Percentage of Various Adulterants in Market Milk Samples
Results of adulterants number and their sequence shown in Table 1 indicate that among 100 market milk samples, highest number (40) of samples were adulterated with only single adulterant i.e. 100% water Group D followed by two adulterants (38 number) i.e. with five sequence (Group C) three adulterants (18 number) with five sequence (Group B) and four adulterants (4 number) with three sequence (Group A). It was further observed that among group A, 25% milk samples were adulterated with sequence of water + formalin + cane sugar + starch, 50% with water + formalin + cane sugar + skimmed milk powder and 25% with water + formalin + skimmed milk powder. However, the sequence of adulterant among group B indicate that 55.5% samples were contaminated with water + cane sugar + skimmed milk powder , 27.77% with water + starch + sodium chloride, 5.56% with water + skimmed milk powder + sodium chloride, 5.56% with Water + formalin + starch and 5.56% with water + formalin + cane sugar. Whilst Group C reveals that 39.47% samples were in sequence of water + skimmed milk powder , 36.8% with water + sodium chloride, 7.90% with water + starch, 7.90% with Water + cane sugar and 7.90% with water + formalin.
Table 1: Adulterants number and sequence observed in market milk samples of Hyderabad city.
| Groups * | Adulterants | |||
| No. of sample (n=100) | No. of adulterants per sample | Sequence | % | |
| A | 4 | 4 | Water + Formalin + Cane Sugar + starch | 25 |
| Water + Formalin + Cane Sugar + SMP | 50 | |||
| Water + Formalin + starch + SMP | 25 | |||
| B | 18 | 3 | Water + Formalin + Cane Sugar | 5.56 |
| Water + Formalin + Starch | 5.56 | |||
| Water + SMP + sodium Chloride | 5.56 | |||
| Water + Starch + sodium Chloride | 27.8 | |||
| Water + Cane Sugar + SMP | 55.5 | |||
| C | 38 | 2 | Water + Formalin | 7.9 |
| Water + Cane Sugar | 7.9 | |||
| Water + Starch | 7.9 | |||
| Water + SMP | 39.5 | |||
| Water + Sodium Chloride | 36.8 | |||
| D | 40 | 1 | Water |
100 |
*Percent has been calculated within same group
Influence of Various Adulterants on Physical Characteristic of Milk
Influence of various adulterants on physical characteristic of milk was examined, and results are presented in Table 2. It was observed that addition of 20% water (1.024±0.001) followed by 10% water (1.027±0.0003) and/or 1% starch+ 10% water (1.028±0.001) to whole milk showed comparatively (P<0.05) lower specific gravity compared to that of control milk (1.030±0.001). While milk admixed with 2% SMP (1.033±0.001) followed by 2% CS (1.033±0.001), 2% CS + 10% water (1.032±0.001), 1% CS + 10% water (1.032±0.001), 1% CS (1.032±0.001), 2% SMP+10% water (1.032±0.001) and 1% SMP (1.032±0.004) revealed significantly (P<0.05) higher specific gravity contrast to that of control milk (1.030±0.001). While milk added with
Table 2: Influence of various adulterants on physical characteristic of milk
| Sr # | Treatment | Specific gravity | Freezing point | pH |
| 1 | Whole milk control |
1.030±0.001de |
-0.525±0.01cde |
6.64±0.02bcde |
| 2 | Milk+10%water |
1.027±0.0003g |
-0.462±0.01b |
6.68±0.03ab |
| 3 | Milk+20%water |
1.024±0.001h |
-0.399±0.01a |
6.72±0.02a |
| 4 | Milk+1%starch |
1.031±0.001cd |
-0.538±0.01def |
6.60±0.03de |
| 5 | Milk+1%starch +10%water |
1.028±0.001fg |
-0.473±0.01b |
6.64±0.02bcde |
| 6 | Milk+2%starch |
1.032±0.001c |
-0.556±0.01defg |
6.62±0.03bcde |
| 7 | Milk+2%starch+ 10%water |
1.029±0.0003ef |
-0.493±0.01bc |
6.65±0.02abcd |
| 8 | Milk+1%SMP |
1.032±0.0004c |
-0.589±0.01gh |
6.66±0.02abcd |
| 9 | Milk+1%SMP 10%water+ |
1.029±0.001ef |
-0.518±0.01cd |
6.64±0.03bcde |
| 10 | Milk+2%SMP |
1.033±0.001a |
-0.657±0.01i |
6.68±0.03abc |
| 11 | Milk+2%SMP+ 10% water |
1.032±0.001c |
-0.572±0.01fg |
6.63±0.02bcde |
| 12 | Milk+1%CS |
1.032±0.001c |
-0.576±0.01fg |
6.68±0.03abc |
| 13 | Milk+1%CS+10% water |
1.032±0.001c |
-0.517±0.01cd |
6.64±0.02bcde |
| 14 | Milk+2%CS |
1.033±0.001ab |
-0.627±0.01hi |
6.72±0.02a |
| 15 | Milk+2% CS+10% water |
1.032±0.0004bc |
-0.560±0.01efd |
6.68±0.02ab |
| 16 | Milk +0.1% formalin |
1.030±0.001be |
-0.539±0.01def |
6.61±0.02cde |
| 17 | Milk+0.2% formalin |
1.030±0.001d |
-0.566±0.03fg |
6.58±0.02e |
| 18 |
LSD (0.05) SE ± |
0.299 0.015 |
0.039 0.196 |
0.067 0.34 |
Means with different superscripts in the same column differed significantly (P<0.05).
Table 3: Influence of various adulterants on chemical characteristic of milk
| Sr# | Treatment | Total solids (%) | Protein (%) | Fat (%) | Lactose/ Total carbohydrate (%) | Ash (%) |
| 1 | Whole milk (control) |
15.54±0.35efg |
3.75±0.15cdefg |
6.10±0.19a |
4.71±0.13fg |
0.98±0.10efgh |
| 2 | Milk+10%water |
13.34±0.28i |
3.15±0.18hi |
5.09±0.18b |
4.13±0.12h |
0.96±0.02efgh |
| 3 | Milk+ 20%water |
11.15±0.44j |
2.80±0.15i |
4.08±0.33c |
3.51±0.12i |
0.77 ±0.03h |
| 4 | Milk+1%starch |
16.46±0.35cde |
3.89±0.18cdef |
6.06±0.18a |
5.18±0.12cde |
0.98±0.12gh |
| 5 | Milk+1%starch +10%water |
14.08±0.24hi |
3.39±0.15gh |
5.20±0.18b |
4.46±0.16jh |
1.3±0.21abcde |
| 6 | Milk+ 2%starch |
16.76±0.32bc |
3.93±0.14bcdef |
6.10±0.18a |
5.37±0.13bc |
1.37 ±0.01defg |
| 7 | Milk+2%starch+ 10%water |
14.60±0.22gh |
3.62±0.14fg |
5.27±0.18b |
4.58±0.13j |
0.95±0.07fgh |
| 8 | Milk+1%SMP |
16.64±0.36cd |
4.17±0.14abc |
6.16±0.19a |
5.25±0.14c |
1.06±0.11defgh |
| 9 | Milk+1%SMP 10%water+ |
14.78±0.23fgh |
3.69±0.15efg |
5.23±0.17b |
4.56±0.16g |
1.30±0.10abcd |
| 10 | Milk+2%SMP |
17.89±0.32a |
4.59±0.14a |
6.22±0.19a |
5.85±0.14a |
1.23±0.17abcdef |
| 11 | Milk+2%SMP+ 10%water |
15.83±0.44Cde |
4.15±0.15abcd |
5.31±0.17b |
5.22±0.15c |
1.2 ±0.16bcdefg |
| 12 | Milk+1%CS |
16.45±0.31cde |
4.07±0.16bcde |
6.06±0.19a |
5.22±0.13cd |
1.11±0.06cdefg |
| 13 | Milk+1%CS+ 10%water |
14.52±0.27h |
3.56±0.15fgh |
5.18±0.18b |
4.60±0.13g |
1.17±0.02bcdefg |
| 14 | Milk+2%CS |
17.60±0.37b |
4.36±0.17ab |
6.09±0.17a |
5.75±0.12ab |
1.4±0.02abc |
| 15 | Milk+2%CS +10%water |
15.65±0.37ef |
3.90±0.17cdef |
5.24±0.18a |
5.03±0.13cdef |
1.5 ±0.17a |
| 16 | Milk+0.1% formalin |
15.70±0.35ef |
3.71±0.17efg |
6.05±0.19a |
4.76±0.14efg |
1.3±0.01abcd |
| 17 | Milk+0.2% formalin |
15.73±0.34de |
3.73±0.17defg |
6.04±0.18a |
4.81±0.14defg |
1.15±0.03ab |
| 18 |
LSD (0.05) SE ± |
0.930 0.469 |
0.44 0.223 |
0.544 0.274 |
0.388 0.195 |
0.279 0.141 |
Means with different superscripts in the same column differed significantly (P<0.05).
1% starch (1.031±0.001), 0.1% formalin (1.030±0.001), 0.2% formalin (1.030±0.001), 2% starch + 10% water (1.029±0.003) and 1% SMP + 10% water indicated relatively similar (P>0.05) specific gravity to that of control milk (1.030±0.001). Moreover, a significant (P<0.05) increase in freezing point was observed when milk was added with 20% water (-0.399±0.01OC), 10% water (-0.462±0.01OC) and 1% starch + 10% water (-0.473±0.01OC) compared to that of control milk (-0.525±0.01OC). While a significant (P<0.05) decrease in freezing point was observed when milk was admixed with 2% SMP (-0.657±0.01OC), 2% CS (-0.627±0.0 OC), 1% SMP (-0.589±0.01OC), 1% CS (-0.576±0.01OC), 2% SMP + 10% water (-0.572±0.01OC) and/or 0.2% CH2O (-0.566±0.01OC) from that of control milk (-0.525±0.0 OC). Freezing point of milk was relatively similar (P>0.005) to that of control milk when 1% SMP +10% water (-0.518±0.01OC), 1% CS + 10% water (-0.517±0.01OC), 1% starch (-0.538±0.01OC), 2% starch (-0.556±0.01OC), 0.1% formalin (-0.539±0.01OC), 2% CS + 10% water (-0.560±0.01OC) and 1% starch (-0.538±0.01OC) was admixed with whole milk. Moreover, a significant (P<0.05) increase in pH value was observed when milk admixed with 20% water (6.72±0.02) and/or 2% CS (6.72±0.02) but there were no any significant differences (P>0.05) found in pH values of whole milk (6.64±0.02) and milk admixed with 1% starch + 10% water (6.64±0.02), 1% SMP + 10% water (6.64±0.03), 1% CS + 10% water (6.64±0.02), 0.1% formalin (6.61±0.02), 2% starch (6.62±0.03), 2% SMP + 10% water (6.63±0.02), 2% starch + 10% water (6.65±0.02), 1% SMP (6.66±0.02), 1% starch (6.60±0.02), 10% water (6.68±0.03), 2% SMP (6.68±0.03), 1% CS (6.68±0.03) and with 2% CS + 10% water (6.68±0.02). While, pH value significantly (P<0.05) decreased to 6.58±0.02 when admixed with 0.2% formalin compared to control milk.
Influence of Various Adulterants on Chemical Characteristic of Milk
Influence of various adulterants on chemical characteristic of milk was examined, and results are presented in Table 3. Total solids (TS) content was significantly (P<0.05) higher in milk with addition of 2% SMP (17.89±0.32%), 2% starch (16.76±0.32%) and/or 2% CS (17.60±0.37%) compared to that of control milk (15.54±0.35%). While addition of 20% water (11.15±0.44%), 10% water (13.34±0.28%), 1% CS + 10% water (14.52±0.27%) and 1% starch + 10% water (14.28±0.24%) showed significantly (P<0.05) lower TS content compared to that of control milk. Moreover, milk added with 2% SMP + 10% water (15.83±0.44%), 2% CS + 10% water (15.65±0.37%), 0.1% CH2O (15.70±0.35%), 0.2% CH2O (15.73±0.34%), 10% water + 2% starch (14.60±0.22%), 1% SMP + 10% water (14.78±0.23%), 1% starch (16.46±0.35%) and 2% CS (16.45±0.31%) indicated relatively similar (P>0.05) TS content to that of control milk (15.54±0.35%). Further, the protein content was remarkably (P<0.05) higher in milk with 2% SMP (4.59±0.14%), 2% CS (4.36±0.17%) and/or 1% SMP (4.17±0.14%) compared to that of control milk (3.75±0.15%). In case of milk added with 20% water (2.80±0.15%) and/or 10% water (3.15±0.18%) showed comparatively (P<0.05) lower protein content compared to that of control milk (3.75±0.15%). While milk admixed with 0.2% CH2O (3.73±0.17%), 0.1% CH2O (3.71±0.17%), 2% CS +10% water (3.90±0.17%), 1% CS + 10% water (3.56±0.15%), 2% starch (3.39±0.15%), 10% water 2% starch (3. 39±0.15%), 1% starch (3.89±0.18%), 1% SMP + 10% water (3.69 ±0.15%), 2% SMP + 10% water (4.15±0.15%) and/or 1% CS (4.07±0.16%) indicated relatively similar (P>0.05) protein to that of control milk (3.75 ±0.15%). It was further observed that addition of 10% water (5.09±0.18%), 20% water (4.08±0.33%), 10% water + 1% starch (5.20±0.18%), 2% starch + 10% water (5.27±0.18%), 10% water + 1% SMP ( 5.23±0.17%), 2% SMP + 10% water (5.31±0.17%), 1% CS + 10% water (5.18±0.18%) 2% C.S + 10% water (5.24±0.18%) and/or 20% water (4.08±0.33%) revealed lower fat content compared to that of control milk (6.10±0.19%) While milk added with 1% starch (6.06±0.18%), 2% starch (6.10±0.18%), 1% SMP (6.16±0.19%), 2% SMP (6.22±0.19%), 1% C.S (6.06±0.19%), 2% CS (6.09±0.17%), 0.1% formalin (6.05±0.19%) and/or 0.2% formalin (3.73±0.17%) showed relatively similar (P<0.05) results compared to that of control milk (6.10±0.19%). Noticed addition of 1% starch (5.18±0.12%), 2% starch (5.37±0.13%), 1% SMP (5.25±0.14%), 2% SMP (5.85±0.14%), 2% SMP + 10% water (5.22±0.15%), 1% CS + 10% water (5.03±0.13%) and 1% CS (5.22±0.13%) to whole milk showed comparatively (P<0.05) higher lactose/total carbohydrate content compared to that of control milk (4.71±0.13%). While milk admixed with 10% water (4.13±0.12%), 20% water (3.51±0.12), 1% starch + 10% water (4.46±0.16%) and/or 2% starch + 10% water (4.58±0.13%) to whole milk revealed significantly (P<0.05) lower lactose/carbohydrate content contrast to that of control milk (4.71±0.13%). While milk admixed with 1% SMP + 10% water (4.56±0.16%), 1% CS + 10% water (4.60±0.13%), 0.1% formalin (4.76±0.14) 0.2% formalin (4.81±0.14%) were relatively similar to that of control milk. Further, the ash content was remarkably (P<0.05) higher in milk added with 10% water + 1% starch (1.3±0.21%), 1% SMP + 10% water (1.3±0.10%), 2% CS (1.4±0.02%), 2% CS + 10% water (1.5±0.17%), 0.2% formalin (1.3±0.10%) and/or 0.1% formalin (1.3±0.03%) compared to that of control milk (0.98±0.10%). While milk admixed with, 10% water (0.97±0.02%), 20% water (0.77±0.03%), 1% starch (0.98±0.12%), 2% starch (1.1±01%), 2% starch + 10% water (0.95±0.07%), 1% SMP (1.06±0.11%), 2% SMP (1.23±0.17%), 1% SMP + 10% water (1.2±0.16%), 1% CS (1.11±0.06%) and/or 1% CS + 10%water (1.1±0.02%), indicated relatively similar (P>0.05) ash to that of control milk (1.15 ±0.13%).
Discussion
Milk adulteration, poor hygiene, malpractices, lack of preservation technology, cooling facilities and sanitation conditions are the main causes of losses in quality of milk (Haasnoot et al., 2004). It was reported that milk supply is reduced in summer due to fall (55%) in milk production and increase in demand (60%) compared to winter when milk supply is ample. To cope with demand, water is admixed with whole milk to increase the volume of milk during summer season Butt (2011). It has been reported that milk adulteration is common in under developing countries and that has direct influence on physico-chemical properties of milk (PSQCA, 2006). In present study an approach was made to observe the common adulterations practiced in market of Hyderabad city and subsequently their influence on physico-chemical characteristics of milk was evaluated. It was observed that no any sample was found to be wholesome / unadulterated among all the milk samples analyzed for adulteration. The water was common adulterant found to be in all the milk samples (100%) evaluated under present study. Similarly, Beniwal and Akhetarpaul (1999) reported that the main adulterant in milk was water found to be in 70% samples among the all samples, while 93.33% samples of milk adulterated with water were recorded by Lateef et al. (2009). It has been noticed that addition of water to normal whole milk was assumed to increase the quantity of milk (Bhatti, 2010). However the addition of water to milk not only reduces the nutritional value of milk but contaminated water may also pose a health risk. Moreover, the results of Wadekar and Menkudale, (2011) indicated that the milk samples collected from vendors were highly adulterated with water than samples collected from dairy farm.
Formalin was another adulterant detected in 34% milk samples from a total of 100 samples in the present study. The proportion of samples adulterated with formalin varied in different studies. For example, in a study conducted by Lateef et al. (2009) reveled 46.66% milk samples adulterated with formalin among the total samples. While, Wadekar et al. (2011) reported the 12% samples in summer, 10% in rainy and 2% in winter season found to be adulterated with formaldehyde. In another study 2.08% milk samples were contaminated with formaldehyde (Ibtisam et al., 2009). It could be agreed that formalin used as preservative of milk to increase the shelf life is not only decreases the nutritive value of milk but also is carcinogenic (Bhatti, 2010; Afzal et al., 2011). Addition of formalin (0.1 or 0.2%) to normal whole milk did not show any significant influence on specific gravity and freezing point of milk. Whilst, it has affected the pH of milk. pH values of normal whole milk was observed as 6.64±0.02 and it was significantly (P<0.05) decreased to 6.61±0.02 in milk added with 0.1% formalin. These results indicate that formalin has produced acidic condition in milk, although this decrease in pH value of normal milk was still comes under normal range of milk.
It is of interest to note that the middle men attempt to counter the dilution by adding cane sugar to extend the solids content of the milk or as additives for the purpose of masking the effect of dilution of water (Farkhar et al., 2006; Singhal et al., 1997). While, starch in milk was used to increase its viscosity or its profit margin (Tariq, 2001; Afzal et al. 2011). Rideout et al. (2008) reported that high amount of starch may cause diarrhea due to the effects of undigested starch in colon, and its accumulation in the body may be fatal in diabetic patients. In current study, significant (P<0.05) influence of cane sugar was observed on the specific gravity of milk. This could be attributed with cane sugar as it has higher specific gravity (1.048) (Guerra and Mujica., 2008) compared to that of normal milk (1.030).
Further, in present study, it was found that 8% milk samples were adulterated with skimmed milk powder. Present results are in agreement with findings of Pitty (2011), who reported relatively similar milk samples positive to skimmed milk powder i.e 6 samples from Mizoram and one from Nagaland. While Sinha (2012), observed 50 (70.42%) milk samples contaminated with glucose and skimmed milk powder out of 71 samples. Aforementioned study further reported that these adulterants are usually added to milk in the lean season to enhance the volumes. In the present study another adulterant sodium chloride was found in 5% milk samples. This adulterant was also detected by Waldekar et al. (2011) from 8% samples in summer, 4% in rainy and 3% in winter season among a total 120 samples analyzed in 3 different seasons. It has been reported that high level of chloride in milk could affect the acid base balance in body and may develop regression loss of acquired immunity, kidney problem, speech and sensory disturbances (Ayub et al., 2007). It has been further observed in the present study that addition of SMP to whole milk had significant (P<0.05) influence on specific gravity and freezing point of milk. While it did not show any remarkable effect on pH value of milk.
It has been observed that significant influence of extraneous water was found on the specific gravity of milk. The specific gravity of whole milk (control) (1.030±0.001) was comparatively (P<0.05) higher than that of milk added with 10% water (1.027±0.0003) and 20% water (1.024±0.001). Present findings are in agreement with that of Wadekar and Menkudale (2011), who reported the lower (1.0139) specific gravity of highly adulterated milk obtained from vendors.
In the present study, a comparable influence of starch on specific gravity of milk was observed. The specific gravity (1.030±0.001) of control milk was significantly lower (P<0.05) than that of milk added with 1% starch (1.031±0.001) and 2% starch (1.032±0.001). This is because of starch which extended the solids content of the milk (Fakhar et al., 2006) and alternately increased the specific gravity of milk. Results also conclude that addition of starch to milk in lower concentration (1%) had no significant effect on TS content of milk, while increasing level of starch up to 2% to milk had comparable influence on TS content. These results are in line with the study conducted by Zia (2007), who reported significant increase in TS content with addition of starch and decrease with addition of extraneous water to whole milk.
Conclusions
From these results, it could be concluded that water is the common adulterants found in market milk in vicinity of Hyderabad followed by formalin, cane sugar, starch and skimmed milk powder. Significant influence of extraneous water was found on physical as well as chemical characteristics of milk. Addition of starch or skimmed milk powder to authentic milk had significantly affected the specific gravity, total solids contents and lactose/total carbohydrates content of milk.
Acknowledgements
Authors are thankful to all supporting staff of Department of APT for their cooperation during conduct of this research work.
Conflict of interest
Authors declare no conflict of interest.
Authors contribution
MAM and MK conceived the design of experiment. MAM done all experiments. NAS, ASM and GSB assisted the experiments, data analysis and writing of this draft. and NAK helped in writing and proof reading of this manuscript.
References


