Journal of Animal Health and Production
Research Article
Journal of Animal Health and Production 1 (1): 10–14Haematological Profile and Blood Chemistry in Diarrhoeic Calves affected with Collibacillosis
Subhash Malik*, Amit Kumar, Amit Kumar Verma, Manoj Kumar Gupta, Som Dutt Sharma, Arvind Kumar Sharma, Anu Rahal
Uttar Pradesh Pandit Deen Dayal Uphadhayay Pashu Chikitsa Vigyan Vishwavidyalaya Evam Go Anusandhan Sansthan (DUVASU), Mathura, UP, India, 281001
*Corresponding author: smalikduvasu2008@gmail.com
ARTICLE CITATION:
Malik S, Kumar A, Verma AK, Gupta MK, Sharma SD, Sharma AK, Rahal A (2013). Haematological profile and blood chemistry in diarrhoeic calves affected with collibacillosis. J Anim. Health Prod. 1(1): 10–14.
Received: 2013–04–01, Revised: 2013–05–01, Accepted: 2013–05–03
The electronic version of this article is the complete one and can be found online at
(
http://nexusacademicpublishers.com/table_contents_detail/11/39
)
which permits unrestricted use, distribution, and reproduction in any medium, provided the original work is properly cited
ABSTRACT
Among the multiple causes, diarrhoea in neonatal calves is one of the most challenging clinical syndromes encountered by large animal veterinary practitioners due to multiple etiologies and its severity. Moreover, the preexisting factors and the intricacy of calf diarrhoea due to bacterial pathogens like E. coli, enforced to conduct research work on some important clinical aspects of the disease with the objectives to study haematological and haemochemistry alterations in positive cases of collibacillosis. Isolation and then identification of bacterial pathogens and confirmation of E. coli strains associated with calf diarrhoea along with their clinical examination of common clinical parameters such as rectal temperature, pulse rate and respiratory rate revealed non–significant difference in body temperature; and significant difference in pulse rate and respiration rate in diarrheic calves in comparison to apparently healthy calves. When haematological parameters were compared, there was a significant increase in parameters like packed cell volume and Total Leukocyte counts which was suggestive of dehydration. The increased number of neutrophils and leukocytosis in early stage of diarrhoea clearly indicated involvement of bacteria. Biochemical profile revealed significant increase in chloride level in diarrheic calves as compared to apparently healthy calves and suggested the presence of hyperchloremia in diarrheic calves.
INTRODUCTION
Diarrhoea during early stage of life in neonates is one of the most severe clinical conditions (Kumar, et al., 2012a, 2013 and Malik et al., 2012). The treatment of diarrheic calves is required at the earliest with the attention to restore all physiological parameters. However, it is not always possible to perform routine blood profile at the door step of owner prior to start the treatment. In such conditions information of haematology may be of great value in the investigations of animal diseases and restoration of normalcy (Mahima et al., 2013). This also helps in suggesting the prognosis and to improve the efficacy of a particular therapeutic regimen, in a particular disease condition like diarrhea. Thus haematological parameters are always helpful for not only giving prognosis but also to improve efficacy of a particular selected therapeutic regimen irrespective of causal agents (Kumar et al., 2012a, 2012b). Diarrhoeic calves showed increased packed cell volume (PCV), indicated fluid losses from vascular compartment (Naylor, 1987), and oral rehydration solution therapy along with other therapeutic measure were effective in bringing back the hydration status of diarrhoeic calves to normal (Dhaliwal,1993) hence packed cell volume (PCV) were good reflection of underlying change in extra cellular fluid (ECF) volume during diarrhoea. Moreover, many times ignored imbalance of minerals and dehydration are the major cause of calves mortality (Malik et al., 2012). Under such conditions the estimation of packed cell volume is of utmost importance to monitor hydration status of animals and is a sensitive indicator for assessing the severity of dehydration as compared to other parameters indicating dehydration. It has been observed that in general significant elevation in haematological parameters as Haemoglobin (Hb), packed cell volume (PCV) and total erythrocyte counts (TEC) due to haemoconcentration are always associated with dehydration (Schalm et al. 1975). Moreover, the clinco–biochemical alterations in diarrhoea are complex in nature characterized by imbalances of fluid altering the electrolyte and acid base status which ultimately endanger the life of patients. The effects of diarrhoea on such parameters as fluid loss, imbalance of electrolyte and acid base are always governed by the type, duration and severity of diarrhea. Other than these common alterations diarrheic calves are also found to have biochemical alterations such as hypoglycemia (Fettman et al. 1986), Hyperproteinaemia and hyperalbuminaemia (Dubey et al. 1992), hyperkalaemia, hyperchloraemia and hyponatraemia, (Sridhar et al. 1988). Keeping all these points in view, the present study was conducted to study haematological and haemochemistry alterations in positive cases of collibacillosis.
MATERIALS AND METHODS
The present study was undertaken on calves up to three months of age exhibiting symptoms of diarrhoea in Western Uttar Pradesh, India. The study included a total of 109 samples (blood and faeces), collected from the calves showing diarrhoea and brought to the laboratory on ice. A total of 109 cases of calf diarrhea from different locations were physically examined and clinical parameters viz., temperature through rectum, pulse rate through coccygeal vein and respiration rate were recorded along with grossly evident clinical signs. The information collected in the form of temperature, pulse rate and respiration rate were pooled and mean were calculated for comparison with normal data as per Benzamin (2007).
The faecal samples of diarrhoeic calves of less than 3 months of age were collected directly from rectum. Approximately 20 grams of faecal contents were collected in sterilized containers (Edwards and Ewing, 1972).
Five to ten ml of blood from each of the 109 diarrheic calves was collected from the jugular vein in aseptic conditions using labeled sterile disposable syringes (Dispovan). About half of the blood was transferred immediately after collection to the sterilized vial containing ethylene di–amine tetra acetic acid (EDTA) solution and half of the blood was transferred to sterilized labeled test tubes for serum. Blood and serum samples were transported to laboratory on ice. In laboratory blood samples were processed immediately for haematological parameters viz., packed cell volume, Haemoglobin, total erythrocyte count, total leukocyte count and differential leukocyte count as per standard procedures (Schalm, 1975).
Haemoglobin was determined by Sahli’s haemoglobinometer. In this method 20 cubic millimeter blood was drawn in Sahli’s pipette and then was transferred to haemometer tube containing 3–4 drops of 0.1N HCl. After proper mixing tube was then allowed to stand still for 4 minutes for the haemoglobin to change into acid haematin. This final fluid was then diluted with distilled water drop–by–drop mixing after each drop until it matched to the colour of the standard comparison tubes. Finally the readings of haemometer tube measured the amount of haemoglobin in g/100 ml of blood.
The RBC pipette was filled up to 0.5 mark with the blood and then diluting fluid (Hayem’s fluid) was drawn up to 101 mark before mixing and finally tube was kept stand still for three minutes. The counting chamber of the haemocytometer was carefully charged with the diluted blood after placing a cover slip. It was ensured that blood cells were evenly distributed over the counting chamber avoiding overloading. The red blood corpuscles present in the four corners small squares and one small central square of the large central square were counted under high power of the microscope. Numbers of erythrocytes per cubic millimeter of blood were calculated by multiplying the total erythrocyte count by factor 10,000, as per the formula
Total erythrocytes = Cells counted x 200 x 10 x 5/mm3
| Where | |
| 200 stands for dilution | |
| 10 stands for depth | |
| 5 stands for 1/5thof square millimeter counted |
The WBC pipette was filled up to 0.5 mark with blood was taken in tube and then WBC diluting fluid was drawn up to 11 mark. Then pipette was shaken to mix properly. The pipette was allowed to stand for three minutes, and fluid in its stem was discarded. Finally to count the cells counting chamber of the haemocytometer was carefully charged with diluted blood after placing cover slip. The cells were counted under low power of the microscope in the large four corner squares of the haemocytometer. The numbers of leucocytes in one cubic millimeter of blood were calculated by multiplying the total leucocytes counted by factor 50, as per the formula:
Leucocytes/mm3 = cell counted x 20 x 10/4
| Where | |
| 20 stands for dilution | |
| 10 stands for depth | |
| 4 stands for the number of square millimeters counted |
Packed cell volume (PCV) was determined by using Wintrobe’s haematocrit tube by filling them with blood by the help of pasteur pipette and centrifuged for 30 minutes at 3000 rpm to note the final reading. Final values were recorded as a percentage.
Thin smear of blood were prepared on dust, lint and grease free clean and dry microscopic slides. These slides were placed on a standing rack and flooded with Leishman’s stain and allowed to act for 2 minutes then dilute the stain on the smear with double the amount of buffered distilled water and mixed gently and allowed to act for 12–15 minutes. To observe in microscope the smear were washed with distilled water, air–dried and examined under oil emersion lens for Differential leucocyte count. Finally under the microscope neutrophils, lymphocytes, monocytes, eosinophils and basophils were differentiated and expressed in percentage.
| % of each type of cell calculates = | Number of cells |
x 100 |
| Total Numbe |
Sodium and potassium estimation was done by Flame photometer as per method described by Oser (1965). The results were expressed in mEq/l. Estimation of chloride was done by Thiocyanate method (Bhattacharya et al., 1978).
| Serum chloride (mEq/L) = | Absorbance of test |
x 100 |
| Absorbance of standard |
The faecal samples collected from diarrheic calves were processed in laboratory for isolation of Escherichia coli, according to procedure described by Edwards and Ewing (1972).
Statistical analysis of data
Mean of parameters obtained were calculated and the data were subjected to test of significance (t test) analyzed against and standard values as described by Snedecor and Cochran (1975).
RRESULT
clinical examination data viz., temperature, pulse rate and respiration rate were pooled and mean calculated (Table 1). These data were compared with normal standards described by Benzamin (2007). On clinical examination of 109 cases of calf diarrhea taken in present study revealed that the diarrhoeic calves showed similar clinical signs as weak, lethargic, anorexic and dehydrated irrespective of age, sex and breed. Clinical parameter viz., body temperature, pulse rate, respiratory rate were also recorded at the time of sample collection.
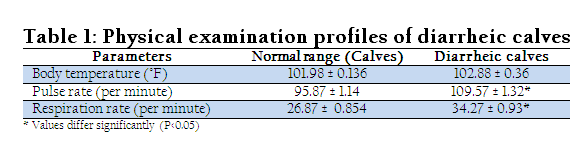
Non–significant difference in body temperature was found in diarrheic calves with early stage of diarrhea (on the basis of history). Whereas, the mean value of temperature recorded for sick calves was 102.88 ± 0.36 degree Fahrenheit (Table 1). There was significant difference in pulse rate and respiration rate in diarrheic calves in comparison to normal values of healthy calves. The mean value of pulse rate in diarrheic cases was 109.57 ± 1.32 per minute (Table1). Increased respiratory rate were found in all the diarrheic calves. The mean value of respiration rate was 34.27 ± 0.93 per minute (Table1). All the faecal samples collected were processed for the isolation and confirmation of E. coli with standard protocol (Quinn et al., 2002). Out of 109 faecal samples from diarrheic calves only 41 revealed E. coli.
The blood samples collected for the study from diarrheic cases (41 cases) were subjected to hematological parameters (Haemoglobin, packed cell volume, total erythrocyte count, total leukocyte count and differential leukocyte count) irrespective of species. All the information collected has been compiled in Table 2.

On hematological examination, there was no significant difference in the haemoglobin concentration between normal and diarrheic calves. On calculation average mean value of Haemoglobin was obtained as 12.2 ± 0.221 g/dl whereas average Hb value of the normal calves is 11.3 g/dl.
The PCV Values in all the diarrheic calves were higher than the normal range. Finally average mean value of packed cell volume was recorded as 44.2 ± 0.692 percent (Table 2). Statistically, there was no significant difference.
The TEC Values in all the diarrheic calves were higher than the normal range. The mean value of the total erythrocytic cell count was 8.54 ± 0.316 million per cm3 (Table 2). Statistically, there was no significant difference. As shown in Table 2, the TLC values in all the diarrheic calves were significantly higher than the normal range. The mean value of Total leukocyte count was 12.4 ± 0.295 thousands per cm3.
From the Table 2, it can also be seen that the neutrophils count was significantly higher in diarrheic calves as compared with the normal values and present study revealed average mean value of neutrophil count as 46.8 ± 0.748 percent. It can be seen that the lymphocyte count was lower in diarrheic calves as compared with the normal values and the average mean value in the present study appeared to be 51.6 ± 0.514 percent for lymphocytes. The monocyte count in all the diarrheic calves was slightly lower in comparison to that of normal values of healthy calves whereas, the mean value of monocytes was 2.72 ± 0.687 percent (Table 2). Statistically no significant difference was observed. The eosinophils percentages, in diarrheic calves were slightly decreased (1.7 + 0.482) in comparison to that of normal value (Table 2). Statistically, there was no significant difference. It is thus evident from the hematology of diarrheic cases of calves that significantly higher PCV indicative of dehydration and leukocytosis with neutrophilia are the characteristic changes in early stage of diarrhea.
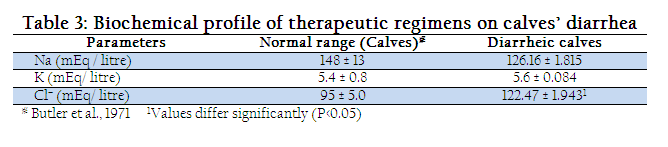
Three common electrolytes (sodium, potassium and chloride) as a measure of homeostssis and water balance were studied and the mean valves of the results have been shown in Table 3. It can be seen that the sodium value in all diarrheic calves was lower (126.16 ± 1.815 mEq/lt) than that of normal values (148 + 13 mEq/lt) but statistically, there was no significant difference. For postassium, it can be seen that the potassium values in all diarrheic calves were slightly higher than that of normal values. The mean value of potassium in diarrheic calves was 5.6 ± 0.084 mEq per litre. Statistically, there was no significant difference. Similarly for chloride, there was significant increase in the chloride values in all diarrheic calves as compared to that of normal values. The mean value of chloride in diarrheic calves was 122.47 ± 1.943 mEq per litre.
DISCUSSION
Diarrhea in calves during early age has mixed etiology and irrespective of etiological agent the physiological conditions, age, breed, sex, stress, nutritional status and treatment always affects mortality (Kumar et al., 2012a, 2012b). In the present study when all the collected samples (blood and faeces) were analyzed as per the standard protocols the percent positivity of 37.61% was recorded in diarrheic calves due to E. coli. These findings indicated the high percentage of E. coli in diarrheic calves as suggested by Malik et al. (2012). The blood was estimated for haematological parameters (Haemoglobin, packed cell volume, total erythrocyte count, total leukocyte count and differential leukocyte count). On haematological examination, there was an increase in haemoglobin concentration in all the calves as shown in Table 2. The increase in hemoglobin was due to haemoconcentration associated with dehydration. Our finding was in concurrence with the findings of Schalm et al. (1975) and Sridhar et al. (1988). PCV revealed a significant elevation of PCV in all the calves as shown in Table 2. Naylor (1987) reported that increased PCV values in diarrhoeic calves indicated fluid loss from vascular compartment. Dhaliwal (1993) and Rajora and Pachauri (2000) reported PCV as indicator of dehydration. Thus, estimation of PCV is of utmost importance to monitor hydration status of animal and is a sensitive indicator for assessing the severity of dehydration. Tennant et al., 1972; Boyd et al., 1974; Bijwal et al., 1985 Sridhar et al., 1988 and Bukhari (2002) have already reported mean PCV value increased upto significant level in diarrhoeic calves. TEC revealed significant elevation of TEC in all the calves as shown in Table 2. Similar to earlier findings, Schalm et al., 1975 and Sridhar et al., 1988, who reported significant elevation of TEC in scouring calves. The cause of this might be the haemoconcentration of blood due to diarrhoea. TLC values of diarrhoeic calves revealed significant elevation of TLC values as shown in Table 2. This finding has supported the finding of Boyd et al. (1974). Sridhar et al. (1988) also reported significant leucocytosis which might have occurred due to normal reaction of body defense mechanism against infection and also due to haemoconcentration due to dehydration. Differential leucocyte count (DLC) includes the count of neutrophils, eosinophils, basophils, lymphocytes and monocytes, which are the suggestive of infectious agents of different origin. The present study revealed increase in neutrophils i.e. neutrophilia and decreased lymphocyte i.e. lymphopenia in diarrheic calves (Table 2). These finding had close agreement with the findings of Singh (1973). Similarly, Sridhar et al. (1988) also reported neutrophilia and lymphopenia in scouring calves. The marked neutrophilic response with lymphopenia is characteristic of acute bacterial enteritis. Monocyte and eosinophils in diarrhoeic calves did not show any significant change.
Water and electrolytes balance is an integral component of homeostasis. Change in water balance is accompanied by changes in electrolyte concentration in all body fluids. Thus, it is obvious that water and electrolyte imbalance associated with certain clinical status like neonatal calf diarrhea need to be suitably compensated at the earliest to avoid life– threatening situation. In the present study, an attempt was made to evaluate the nature and magnitude of electrolyte imbalance and relative efficacy of various therapeutic regimens with suitable infusion. The present study revealed significant reduction of Na values in diarrheic calves (Table 3). These findings were in agreement with observations of Bijwal et al., 1985 and Sridhar et al., 1988. Similarly, Aly et al. 1996 and Dubey and Rao (1997) also reported hyponatreamia in diarrheic calves due to an excessive secretion of sodium along with water into intestinal lumen. These finding were contrary to that of Kaur et al. (2006), who recorded hypernatraemia in diarrhoeic calves as compared to healthy calves. The present study revealed elevation of potassium levels in all the diarrheic calves (Table 3). Hyperkalaemia was due to increased potassium retention by kidney and also due to cellular damage (Fisher et al, 1983). Similar observations have been reported by other workers such as Sridhar et al., 1988, Groutides and Michell (1990), and Kaur et al., (2006). Serum chloride values of diarrhic calves showed elevation of chloride values in diarrheic calves (Table 3). These finding were similar to observations of Sridhar et al., (1988). They reported hyperchloraemia in scouring calves, it might be due to liver dysfunction leading to an increase in capillary permeability with the loss of colloidal protein into tissue and resulting increased serum chloride. Gross (1988) reported metabolic acidosis resulting due to the excess of H+ and deficit of NaHCO3. in the pathogenesis of this condition , due to overproduction of H+ and Cl– released from the RBCs to maintained the electro neutrality and to cope with the loss to anion (HCO3–) and the results eventually in hyper–chloraemia.
ACKNOWLEDGEMENTS
The authors are highly thankful to Dean, College of Veterinary Sciences and Animal Husbandry and Hon’ble Vice Chancellor, DUVASU, Mathura; for providing all the necessary facilities to conduct the study. The assistance of all the staff members of Teaching Veterinary Clinical Complex, Department of Veterinary Microbiology and Immunology and the livestock owners is highly acknowledged..
REFERENCES
Aly AO, Abd-El-Wahed Zh, Kohilo K and El-Shiekh AR (1996). Some studies on clinical, haematological and biochemical Change in diarrhoeic neonatal buffalo calves with reference to hygienic conditions. Assiut. Vet. Med. J. 35 (69): 91-104.
Benzamin MM (2007). Outline of Veterinary clinical Pathology. 3rd Edn. Kalyani Publishers, New Delhi.
Bhattacharya K, Chakraborty GK and Chakravarti G (1978). In: a handbook of clinical pathology: technique and interpretation. Ed. 3. Academic publishers, Kolkata. pp 81-83.
Bijwal DL, Misra SK and Gupta PP (1985). Biochemical and clinicopathological changes in experimental enteric colibacillosis in calves. Acta Vet. Yugoslavia. 35: 305-318.
Boyd JW, Baker JR and Leyland A (1974). Neonatal diarrhoea in calves. Vet. Rec., 95: 310-313.
http://dx.doi.org/10.1136/vr.95.14.310
PMid:4615425
Bukhari SMH (2002). Chemo-prophylactic trials against neonatal calf diarrhoea and the study of relevant haematological and serological parameters. Online J. of Biological Sci. 2(9): 569-572.
http://dx.doi.org/10.3923/jbs.2002.569.572
Dhaliwal PS (1993). Studies of fluid and electrolyte imbalance in buffalo calves with special reference to its therapy. Ph. D. dissertation, Punjab Agriculture University, Ludhiana.
Dubey GK, Gehlaut BS, Sharma IJ and Rao KNP (1992). Studies on disturbances in serum electrolytes in bovine entric colibacillosis. Indian Vet J. 69: 408-410.
Dubey RD and Rao KNP (1997). Some observations on neonatal diarrhoea in buffaloes. Indian Vet. J. 74: 677-679.
Edwards R and Ewing WH (1972). Identification of Enterobacterceae. 3rd edn., Burgess Publishing Company, Minnesota.
Fettman MJ, Brooks PA, Burrows KP and Phillips RW (1986). Evaluation of commercial oral replacement formulas in healthy neonatal calves. J. Amer. Vet. Med. Assoc. 188(4): 397-401.
PMid:3949616
Fisher W., Amisberg, G. and Sahal, M. (1983). Therapeutic efficacy gentamicin formulation and the antidiarrhoeal agent in Escherichia coli infection in calves. Schweizer Archiv Fur Tieheiliunde. 125 (b): 394-409.
Gross DR(1988). General concept of fluid therapy. In: Veterinary Pharmacology and Therapeutics. (Edited by Booth, N.H. and Mc Donald, L.E.) 6th edn., (lowa State University Press, Ames, USA. Pp.480-486.
Groutides CP and Michell AR (1990). Evaluation of acid-base disturbances in calf diarrhea. Vet. Rec. 126: 20-31.
Kaur K, Randhawa SS and Chhabra S (2006). Haemato-biochemical profile of diarrhoeic dairy calves affected with colibacillosis. Indian J. Vet. Med. 26(1): 9-11.
Kumar R, Verma AK, Kumar A, Srivastava M and Lal HP (2012a). Prevalence and antibiogram of campylobacter infections in dogs of Mathura, India. Asian Journal of Animal and Veterinary Advances. 7(5): 734-740.
http://dx.doi.org/10.3923/ajava.2012.434.440
Kumar R, Verma AK, Kumar A, Srivastava M and Lal HP (2012b). Prevalence of campylobacter spp. in dogs attending veterinary practices at Mathura, India and risk indicators associated with shedding. Asian Journal of Animal and Veterinary Advances. 7(8):754-760.
http://dx.doi.org/10.3923/ajava.2012.754.760
Kumar A, Verma AK, Malik S, Gupta MK, Sharma, A and Rahal A (2013). Occurrence of extended spectrum Beta-lactamases producing alpha hemolytic Escherichia coli in Neonatal diarrhea. Pak. J. Biol. Sci. doi. 10.3923/pjbs.2013
Mahima, Singh KV, Verma AK, Kumar V, Singh SK and Roy D (2013). Hematological and serum biochemical profile of apparently healthy Hariana Cattle heifers in Northern India. Pak. J. Biol. Sci. 16(21): 1423-1425.
Malik S, Verma AK, Kumar A, Gupta MK and Sharma SD (2012). Incidence of calf diarrhea in cattle and buffalo calves in Uttar Pradesh, India. Asian Journal of Animal and Veterinary Advances, 7: 1049-1054.
http://dx.doi.org/10.3923/ajava.2012.1049.1054
Naylor JM (1987). Severity and nature of acidosis in diarrhoeic calves over and under one week of age. Canadian Vet. J. 28: 168-173.
PMid:17422754 PMCid:PMC1680400
Oser BL (1965). Hawk Physiological chemistry. 14th edn., Tata McGraw Book Co., Mumbai.
Quinn PJ, Markey BK, Carter ME, Donnelly WJC, Leonard FC (2002). Veterinary Microbiology and Bacterial Disease. Black Well Science, London. pp. 1-648.
Rajora VS and Pachauri SP (2000). Laboratory assessment as an aid to rehydration therapy in neonatal diarrhoeic calves. Indian J. Vet. Med. 20 (1): 18-20.
Schalm OW, Jain NC and Carrol EJ (1975). Veterinary Haematology 3rd edn. Lea and Febiger Publication, Philadelphia.
Singh BB and Singh BP (1973). Mortality rate in relation to birth weight of Haryana calves. Ind. Vet. J. 50:164.
Snedecor GW and Cochran WG (1975). Statistical methods, Oxford and IBH, New Delhi.
Sridhar S, Pachauri SP and Kumar R (1988). Clinico-pathological alteration in calf scours. Indian Vet. J. 65: 771-774.
Tennant B, Harrold D and Reina-Guerra M (1972). Physiologic and metabolic factors in the pathogenesis of neonatal enteric infections in calves. J. Am. Med. Assoc., 193: 993


