Journal of Animal Health and Production
Research Article
J. Anim. Health Prod. 9(4): 504-511
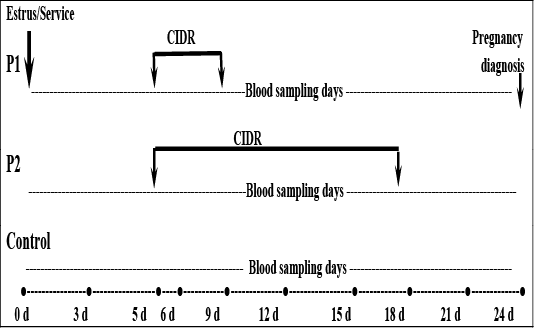
Figure 1
Diagram of the experimental design
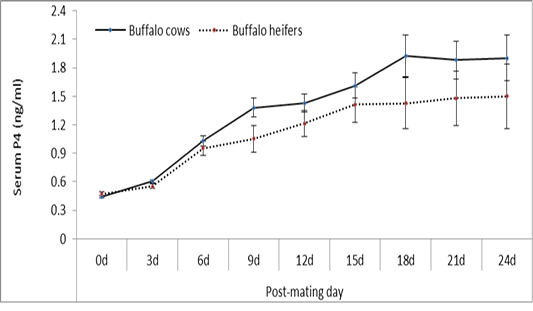
Figure 2
Changes in serum P4 concentration at estrus and successive post-mating days of buffalo cows (n= 30) and heifers (n= 15).
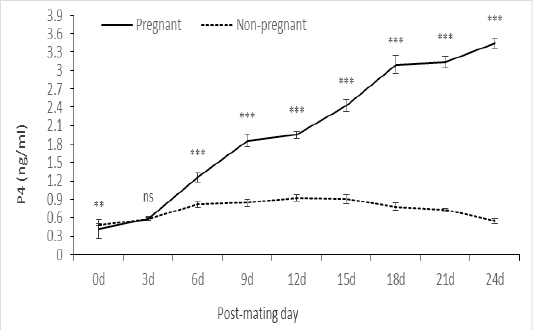
Figure 3
Serum P4 level at estrus and post-mating of pregnant (n= 19) and non-pregnant (n= 26) animals. ns: not significant; **: significant at P<0.01; ***: significant at P<0.001
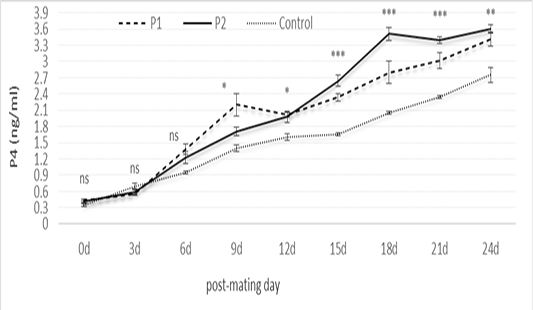
Figure 4
Serum P4 level at estrus and post-mating of pregnant animals in P1 (n= 7), P2 (n= 10), and controls (n= 2). ns: not significant; *: significant at P<0.05; **: significant at P<0.01; ***: significant at P<0.001
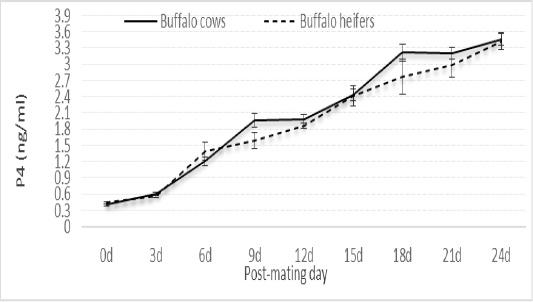
Figure 5
Serum P4 level at estrus and post-mating of pregnant cows (n= 14) and heifers (n= 5).


