Journal of Animal Health and Production
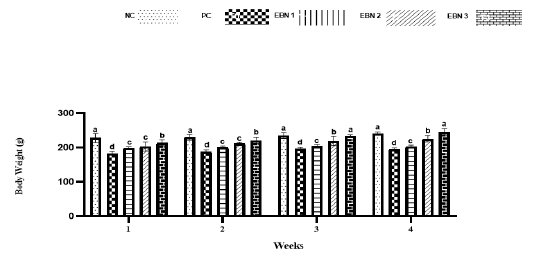
Effect of EBN on the body weight of rats. Data are presented as means ± standard error (SE). Different letters a, b, c within rows denotes significant difference at p < 0.05.
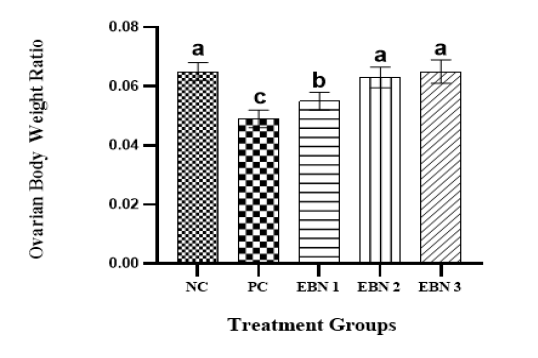
Effect of EBN and CdCl2 on Ovarian - body weight ratio. Values are expressed as Mean ± SEM. Bar graphs with different alphabets show significant differences at P< 0.05.
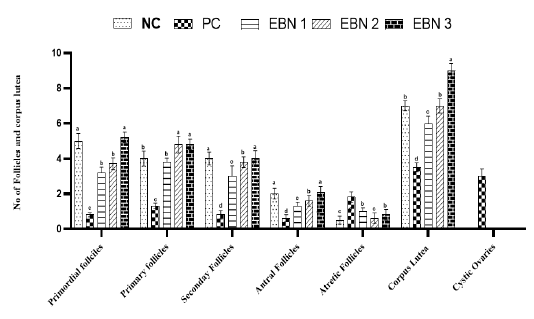
Effect of EBN on development of follicles after Cd exposure in female rats. Data are presented as Mean± SEM. Different letters a, b, c, and d exhibit significant differences at p <0.05. Note. Increase in no of growing follicles in negative control and EBN treated groups as compared to PC group (Cd only treated group). A significant rise in the number of cystic follicles is evident in the PC group.
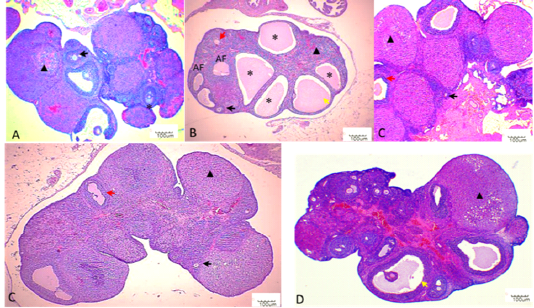
Histopathological findings in ovaries. Photomicrographs were taken at 40X. Black arrows indicate primary follicle, and red arrows indicate secondary follicle, yellow arrow indicate antral follicle, asterisk indicate ovarian cyst, black triangle indicates corpus luteum. A: NC; B: PC; C: EBN 1; D: EBN 2, and E: EBN 3.
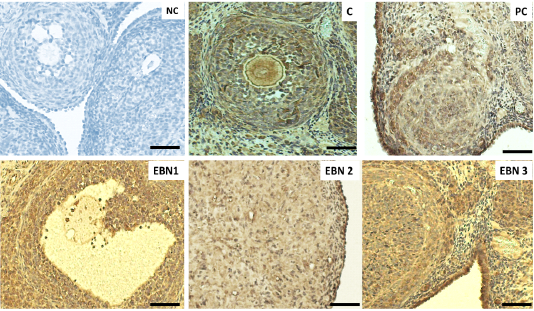
Immunohistochemical expressions of VEGF in ovaries. Photomicrograph sections of ovaries different experimental groups treated with CdCl2 and different doses of EBN showing VEGF expression. A remarkably higher VEGF expression on the ovarian surface and interstitial cells are visible in negative control, and EBN treated groups as compared with the PC group. (× 400 magnification, Scale bar = 50µm).
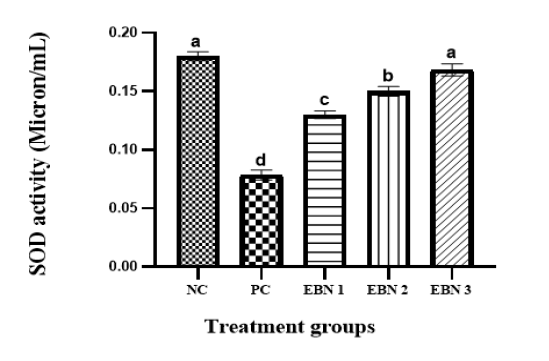
Plasma levels of SOD activity in NC, PC, and EBN treated groups. Values are mean ± SEM. Note: the increase in SOD activity in a dose-dependent manner with EBN supplement with all doses of EBN treatment showing a significant improvement compared to PC. P = 0.05.


