Journal of Animal Health and Production
Research Article
J. Anim. Health Prod. 9(s1): 20-25
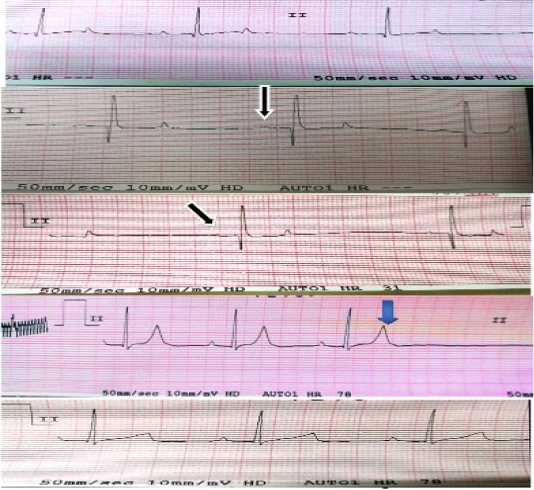
Figure 1
Electrocardiographic changes in case of hyperkalemia: Black arrows show decrease amplitude of P-waves (flat p-wave). Blue arrow shows tall peaked T-wave.
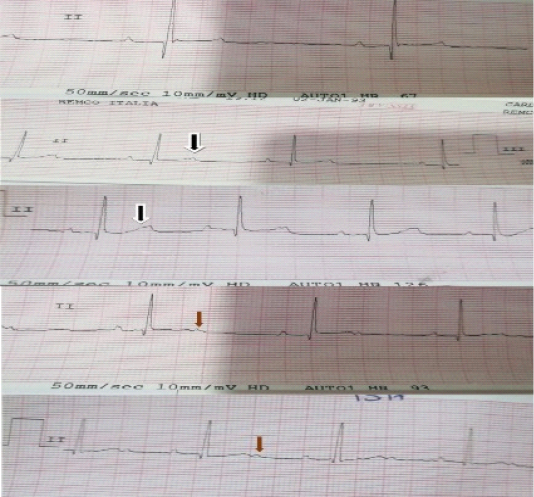
Figure 2
Electrocardiographic changes in case of hypokalemia: black arrows show bifid or notched T-waves, red arrows show appearance of prominent U-waves.
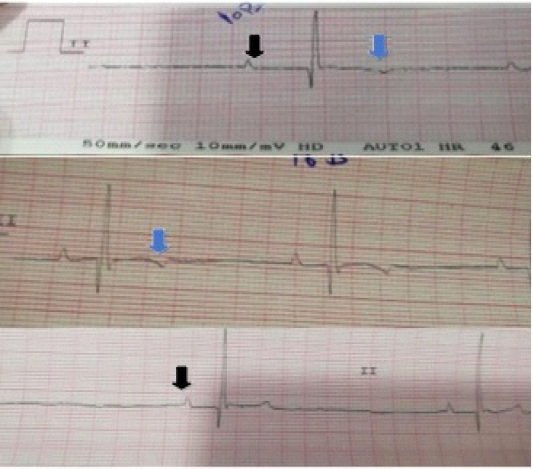
Figure 3
Electrocardiographic changes in case of hypokalemia: black arrows show peaked tall P-waves (increased amplitude), blue arrows show inversion of T-waves which appeared in some traces at 10th day of treatment.


