Journal of Animal Health and Production
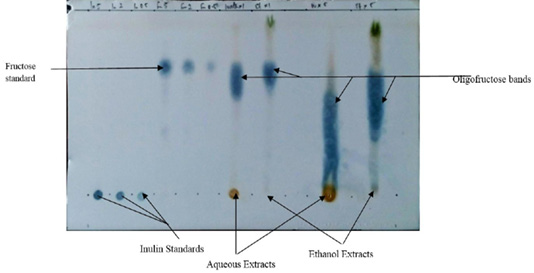
Thin layer chromatogram of O. gratissimum showing the separation bands.

Mean body weights of the experimental broilers (4 weeks).
A: Healthy control; B: Infected with E. coli but without Treatment; C: Infected with E. coli and treated with Norfloxacin (15g/L); D: Infected with E. coli and treated with Ocimum gratissimum (40g/L).
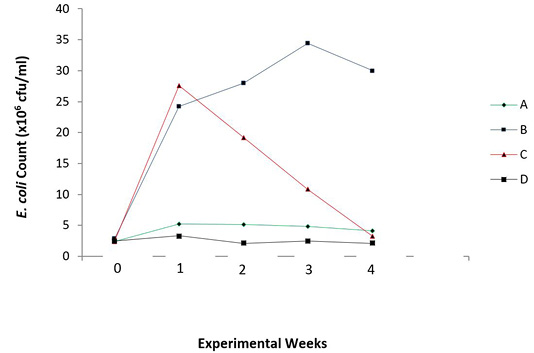
Total E. coli count in the caecum of experimental broilers.
A: Healthy control; B: Infected with E. coli but without treatment; C: Infected with E. coli and treated with Norfloxacin (15g/L); D: Infected with E. coli and treated with Ocimum gratissimum (40g/L).

Total lactic acid bacteria count in the caecum of experimental broilers.
A: Healthy control; B: Infected with E. coli but without treatment; C: Infected with E. coli and treated with Norfloxacin (15g/L); D: Infected with E. coli and treated with Ocimum gratissimum (40g/L).
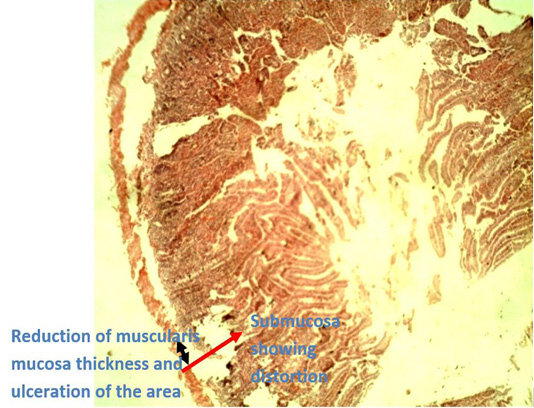
Photomicrograph of caecum of Group B (infected with E. coli but without treatment) showing reduction of thickness of the muscularis mucosae (black arrow head) due to ulceration of the area which went deep into the submucosa (red arrow) leading to ulcerative.

Photomicrograph of caecum of Group D chicken (infected with E. coli and treated with O. gratissimum extract) showing: (1) Minor hemorrhage in the lumen (oval shape) (2) Distorted muscularis mucosa (double arrow head). (3) Vacuolation present keeping for minor onset of accumulation of lipids which is one of the roles played by prebiotics. (H and E. mag. 100X). The prebiotic was able to maintain the caecal architecture of the infected chicks.


