Journal of Animal Health and Production
Research Article

The Role of Programmed Cell Death in the Reorganization of Bovine Corpus Luteal Cells
Sang-Hwan Kim1, Jong-Taek Yoon1,2*
1Institute of Genetic Engineering, Hankyong National University, 327, Jungang-ro, Ansung, Gyeonggi-do, 17579, Korea; 2Department of Animal Life and Environment Science, Hankyong National University, 327, Jungang-ro, Ansung, Gyeonggi-do, 17579, Korea.
Abstract | The precise timing of the synthesis and degradation of steroid hormones is crucial for reproductive success. Despite its importance, the luteolytic phenomenon is not well understood, as there is little information regarding the process of luteal cell death during the development of the corpus luteum. In this study, we investigated factors associated with apoptosis during corpus luteum formation according to luteal stage. To determine the function of programmed cell death at the early stage of corpus luteum development, we examined the expression patterns of apoptosis- and autophagy-related genes, which play important roles in the structural regression of the corpus luteum, and found that they were similar to or slightly different from the expression pattern of 20α-hydroxy steroid dehydrogenase. The levels of TNF and Casp-3, which induce apoptosis, were decreased at early luteal stages (CH2 and CH3), while the expression of autophagy genes was high between the CH3 and CL3 stages, and the expression of ATG5, P62, and MAP1LC3A-II, which are autophagy-activating factors, began to increase substantially in theca cells, which are later transformed into luteal cells. Based on the results of these experiments, luteal cells are not simply reorganized by cell apoptosis but instead, a yet unknown hormone control mechanism affects autophagy in early luteal cells and apoptosis at later stages, and plays an important role in the increased hormone synthesis and reorganization of luteal cells.
Keywords | Apoptosis, Autophagy, Estrus, Corpus luteum, Bovine.
Received | August 20, 2019; Accepted | September 02, 2019; Published | September 15, 2019
*Correspondence | Jong-Taek Yoon, Department of Animal Life and Environment Science, Hankyong National University, 327, Jungang-ro, Ansung, Gyeonggi-do, 17579, Korea; Email: jtyoon@hknu.ac.kr
Citation | Kim SH, Yoon JT (2019). The role of programmed cell death in the reorganization of bovine corpus luteal cells. J. Anim. Health Prod. 7(3): 119-125.
DOI | http://dx.doi.org/10.17582/journal.jahp/2019/7.3.119.125
ISSN | 2308-2801
Copyright © 2019 Kim and Yoon. This is an open access article distributed under the Creative Commons Attribution License, which permits unrestricted use, distribution, and reproduction in any medium, provided the original work is properly cited.
Introduction
The formation and regression of the CL cause hormonal and physiological changes, and abnormal regression of the CL causes early abortion due to the formation of CL cysts and decreased progesterone production (Shi and Segaloff., 1995; Lei et al., 1991). Therefore, the appropriate formation and regression of the CL are important for normal livestock reproduction. Regression of the CL is one of the most important mechanisms for the return to estrus after parturition, and it begins with a decrease in blood levels in the CL, polyphagia, and prostaglandin (PG)F2α synthesis (McCracken et al., 1999). A key factor for functional regression of the CL is 20α-hydroxy steroid dehydrogenase (20α-HSD), which inhibits progesterone synthesis, and 20α-HSD in ovarian tissues increases sharply during CL regression (Bruce and Walter., 1966; Nakajin et al., 1989). It has been reported that 20α-HSD converts progesterone to inactive 20a-hydroxypregn-4-en-3-one (20α-OHP) under the control of prolactin (PRL) and controls the function of the CL (Nakajin et al., 1989). For structural regression of the CL, depression of the insulin growth factor (IGF) cytokine pathway and nitric oxide (NO) seem to play pro-apoptotic and anti-apoptotic roles, respectively, in the bovine CL (Petroff et al., 2001; Skarzynski et al., 2005). NO interacts with PGF2α to control CL function during the bovine estrous cycle (Skarzynski et al., 2005) and stimulates the apoptosis of ovarian tissues by causing hypoxia in the CL (Bruick., 2000; Li et al., 2003; Matsushita et al., 2000; Lee et al., 2005). Another mechanism involved in the structural regression of the CL is autophagy. A combination of genes associated with
Table 1: Luteal morphological criteria for determining bovine estrous cycle day
| Criteria | Developmental stage of corpus luteum | ||||
| CH2 | CH3 | CL3 | CL2 | CL1 | |
| Surface |
Ovulatory point partially covered by epithelial/Luteal cells |
Covered by luteal tissue |
Covered by luteal tissue |
Covered by luteal/ connective tissue |
Covered by connective tissue |
| Color of luteum | Brownish red | Reddish brown | Tan to orange | Orange to yellow | Light yellow to white |
| Diameter (cm) | 1.1~1.6 | 1.8~2.0 | 2.1~2.8 | 2.3~2.5 | 1.5~2.0 |
| Stage of the estrous cycle | days 1 to 4 | days 5 to 10 | days 11 to 17 | days 18 to 20 |
After days 20 |
Table 2: Primers for real-time PCR analysis of autophagy-associated genes
| Cell survival signal-associated genes | ||
| Primer name | Sequence | Gene ID. |
| Bos PCNA FW | 5' GCA CTG AGG TAC CTG AAC TT 3' | NM_001034494.1 |
| Bos PCNA RV | 5' TCT TCA TCC TCG ATC TTG GG 3' | |
| Bos BCL-2 FW | 5' GCA TCG TGG CCT TCT TTG AGT 3' | NM_001166486.1 |
Table 3: Primers used for real-time PCR analysis of apoptosis-associated genes
| Apoptosis associated genes | ||
| Primer name | Sequence | Gene ID. |
| Bos TNF Fw | 5' CAC CAC CAC CAT CTG CTT 3' | NM_173966.3 |
| Bos TNF RV | 5' TCT GAA CTG GGG TGC AGA 3' | |
|
Bos 20α-HSD FW |
5' GGA AAG CGG ATA GTC AGG GTG ATC 3' | NM_001167660.1 |
|
Bos 20α-HSD RV |
5' GCC ATT GCC AAA AAG CAC AAG 3' | |
| Bos Casp-3 FW | 5' AGC CAT GGT GAA GAA GGA ATC A 3' | NM_001077840.1 |
| Bos Casp-3 RV | 5' GGT ACT TTG AGT TTC GCC AGG A 3' | |
| Autophagy associated genes | ||
| Primer name | Sequence | Gene ID. |
| Bos Beclin-1 FW | 5' CGC AGC TGG ATA AGC TGA AG 3' | NM_001033627.2 |
|
Bos Beclin-1 RV |
5' AGA GCA TGG AGC AGC AAC AC 3' | |
| Bos ATG1 FW | 5' CAG CGC ATT GAG CAG AAC CTC AGT 3' | NM_001045934.2 |
| Bos ATG1 RV | 5' GAT GGT TCC GAC TTG GGG AGA TTG T 3' | |
| Bos ATG13 FW | 5' TGT ATC AAA CAG CAG CGA GG 3' | NM_001076812.1 |
| Bos ATG13 RV | 5' ACG AAG TCG TCC TGG GTA TG 3' | |
| Bos ATG5 FW | 5' TTT TGC ACA AGA GGC TGG TC 3' | NM_001034579.2 |
| Bos ATG5 RV | 5' CCT ACT GCA AAG GCC TGA CA 3' | |
| Bos MAP1LC3A FW | 5' CAG CAT GGT GAG TGT GTC CA 3' | NM_001046175.1 |
| Bos MAP1LC3A RV | 5' GCA GCT CAG TTC AGG AAC CA 3' | |
| Bos SQSTM1 FW | 5' AGG ATG ACA TCT TCC GCA TT 3' |
NM_176641.1 |
autophagy after the decrease in mTOR, which is a survival signal in the cells, lead to the formation of an autophagic lysosome, which disintegrates the chemical materials in the cells (Levine et al., 2004; Klionsky et al., 2000). Morales et al. (2000) reported that induction of apoptosis in steroidogenic cells via autophagy causes CL regression in primates. However, the mechanisms of apoptosis and autophagy during the normal development and regression of the CL are not well understood, and there is almost no research data on the effect of apoptosis on the functional and structural roles of the CL. Therefore, the objective of this study was to investigate the effects of apoptosis-related factors on CL formation at various development stages.
Materials and methods
Animals
This study was carried out in strict accordance with the recommendations in the Guide for the Care and Use of Laboratory Animals of the National Institutes of Health. The protocol was approved by the Committee on the Ethics of Animal Experiments of Hankyong National University (Permit Number: 2016,2016-001). The research was conducted on 30 Korean Holstein cows and the superovulation procedure was conducted as described by Kim et al. 2014. For the cows, four days after the insertion of Progesterone Releasing Intravaginal Device (CIDR; Hamilton, New Zealand) into the vagina of cows using a CIDR injector, estrus cycle was induced by the administration of FSH (Kyoritsu seiyakucoporation, Japan) for 4 days with an interval of 12 hr between each FSH injection. PGF2α (Zoetic, Belgium) was administered 2 days after FSH injection. After 3 days the CIDR was removed and estrus of cows was visually monitored for mounting activities and mucus discharge. The corpus luteum was obtained by slaughtering at the slaughterhouse at Pyeong-Nong, Pyeongtaek, Korea according to the estrous and luteal formation period presented by Okuda et al., 1988. The schematic time schedule of the corpus luteum collection is shown in Table 1.
Collection and Preparation of Ovarian Tissue
The CL was removed transvaginally from regularly cycling dairy cows with physiological saline (PBS), cut open along their longitudinal axes, and processed as follows. The CL were cut into four pieces, three of which were immediately snap frozen in liquid nitrogen, transported to the laboratory, and stored at −80°C until RNA extraction. In the first experiment, the CL were removed at five different stages of the estrous cycle; the corpora hemorrhagic (CH) stages CH2 and CH3, and the CL stages CL3, CL2, and CL1 (Table 1) (Lee et al., 2015; Ireland et al., 1980; Okuda et al., 1988).
Total RNA Extraction
For the first experiment, frozen tissue was homogenized in TRIzol reagent (Brinkman Instruments, Westbury, NY) using a polytron tissue homogenizer. In the second experiment, RNA from cultured cells was isolated by adding TRIzol reagent directly to culture flasks. Following tissue homogenization or cell lysis, total cellular RNA was isolated according to the manufacturer’s instructions. The final RNA precipitate was resuspended in double-distilled water containing 0.1% diethyl pyrocarbonate (DEPC), and the RNA concentration was determined by measuring the absorbance at 260 and 280 nm using an ultraviolet spectrophotometer. The A260:A280 ratio of all RNA samples was >1.8. RNA integrity was assessed by examining the 28S and 18S ribosomal RNA bands on an ethidium bromide-stained agarose-formaldehyde gel. The samples were stored at −80°C until use.
Real-Time Polymerase Chain Reaction
Gene expression levels at each CL developmental stage (CH2, CH3, CL3, CL2, and CL1) were examined by real-time polymerase chain reaction (Real Time-PCR). The primers used to amplify the genes of interest are listed in Tables 2 and 3. Reverse transcription and PCR amplification were performed using the one-step SYBR Real Time-PCR kit (TaKaRa, Shiga, Japan) and line-gene K program (Bioneer Technology, Tokyo, Japan). Each PCR was repeated at least three times, and the results were converted to fold increase according to the cycle threshold (Ct) values in a semi-log amplification plot of the geometric region using Rotor-Gene Real-Time Software 6.0 (BIOER, Tokyo, Japan).
Western Blot Analysis
Protein extracts (30 µg) from CL tissue were separated in duplicate by sodium dodecyl sulfate-polyacrylamide gel electrophoresis (SDS-PAGE) on 13% gels and then transferred onto a polyvinylidene fluoride (PVDF) membrane (Bio-Rad, Hercules, CA, USA). The membranes were blocked with 5% non-fat dry milk overnight at 4°C, and then washed for 10 min with TBS-T washing buffer (50 mM Tris-HCl, pH 7.6, 200 mM NaCl, 0.1% [v/v] Tween 20). The membranes were incubated for 2 h with primary antibodies (1:1000 dilution) that recognize the active form of 20α-HSD (Kim et al., 2014), Casp-3 (ab4051; Abcam, San Francisco, CA, USA), mTOR (sc-8319), SQSTM1 (sc-25575), P62 (sc-25523), ATG5 (sc-8667), MAP1LC3A (sc-134226), and β-actin (sc-47778; all from Santa Cruz Biotechnology, Santa Cruz, CA, USA). After primary antibody binding, the membranes were washed three times with TBS-T buffer for 15 min each, and then incubated for 2 h with an HRP-conjugated secondary anti-rabbit (sc-2054), anti-mouse (sc-2054 and sc-2031, all from Santa Cruz Biotechnology), or anti-goat (diluted 1:5000 in blocking buffer) antibodies. The membranes were incubated with the ECL detection reagent for 5 min in the dark, and then exposed to X-ray film for 10 min. Finally, relative protein expression was normalized to that of β-actin, which served as an internal control, using Alpha Innotech, ver. 4.0.0 software (San Leandro, CA, USA) as an internal control.
Immunohistochemistry
Immunohistochemical detection of target proteins was performed on five 5-µm tissue sections mounted on siliconized slides. Briefly, paraffin sections were dewaxed with a xylene substitute (Polysciences, PA, USA) and rehydrated with a graded series of ethanol. Antigen retrieval was performed by heating at 95°C in 10 mM sodium citrate (pH 6.0). Endogenous peroxidases were quenched by incubation with 0.3% hydrogen peroxide in methanol for 5 min at room temperature. After three washes in 1× PBS buffer, the slides were blocked with 1% goat serum in blocking buffer and 3% horse serum in PBS for 1 h at room temperature. Sections were labelled by incubation with antibodies (diluted 1:150 in blocking buffer) against 20α-HSD, Casp-3, MAP1LC3A, and P62 overnight at 4°C. The sections were washed in PBS and then incubated with secondary anti-rabbit (sc-2054), anti-mouse (sc-2054 and sc-2031), and anti-goat antibodies, or HRP-conjugated anti-FITC antibodies (Takara, Osaka, Japan) diluted 1:300 in blocking buffer for 1 h at room temperature, and then rinsed and incubated for 10 min with the ABC detection kit (Vector, CA, USA) for 10 min. Diaminobenzidine (Vector) was used as a substrate for HRP. Sections were counterstained with periodic acid-Schiff (PAS) reagent and Harris hematoxylin solution containing 4% acetic acid. Tissues were dehydrated, cleared, and covered with Permount solution (Fisher, NJ, USA).
Statistical Analyses
The real-time RT-PCR results were analyzed for statistical significance using the SAS package (version 9.4; Statistical Analysis System Institute, Cary, NC, USA). Data were subjected to Welch’s t-test, fold change, and GLM in SAS. Data are the mean ± SD, and differences between groups were considered significant when p values were less than 0.05.
Results
Expression Patterns of Apoptosis-Associated Genes by Cl Development Stage
The expression levels of TNF and caspase-3 during CL development, were low at the CH stages. However, their expression increased from the CL3 to CL1 stages (Figure 1A) and their expression was significantly higher (p < 0.05) at the CL1 (CL regression) stage. At the CL3 stage, TNF expression was low, whereas caspase-3 expression was slightly high. A similar trend was observed for Caspase-3 protein expression; it was very low at the CL3 stage, and was high at the CL2 and CL1 stages. Expression of the 20α-HSD gene was low from the CH2 (early luteal stage) stage to the CL3 stage, but was significantly (p < 0.05) high at the CL2 stage and low at the CL1 stage. Protein levels were low at CH2 and CL3, and high at CL2 and low again at CL1 (Figure 1B).
Expression Patterns of Autophagy-Associated Genes by Cl Development Stage
Expression of Beclin-1, which activates autophagy, was significantly (p < 0.05) high at the CL3 stage, but low at the other stages. The expression of BCL-2, which controls autophagy by inhibiting Beclin-1, showed a pattern opposite to that of Beclin-1, and the expression of ATG1, which is a factor involved into the formation of the autophagosome membrane and binds to Beclin-1, was similar to that
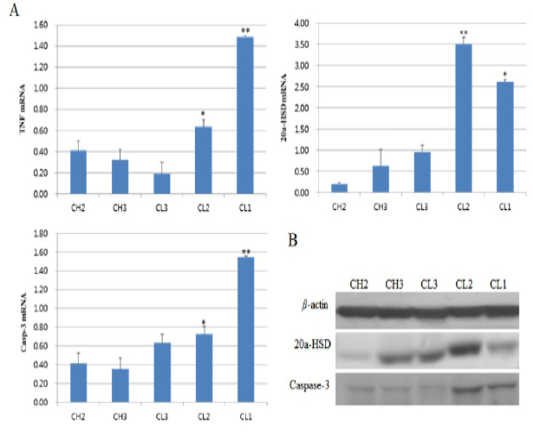
Figure 1: Expression of apoptosis-associated genes according to luteal stage. A is picture from real-time PCR and B is figure about western blot. CH2, 3: Corpus hemorrhagicum, 2, 3; CL3, 2, 1: corpus luteum 3, 2, 1. Asterisks indicate significant differences (p < 0.05).
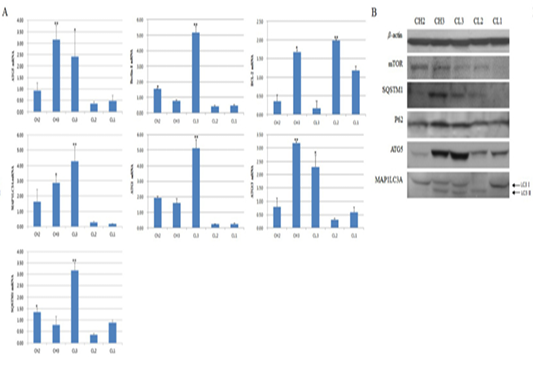
Figure 2: Expression of apoptosis-associated genes by luteal stage. A is picture from western blot and B is figure about real-time PCR. CH2, 3: Corpus hemorrhagicum 2, 3; CL3, 2, 1: corpus luteum 3, 2, 1. Asterisks indicate significant differences (p < 0.05).
of Beclin-1. Expression of ATG13, which binds to ATG1, was significantly (p < 0.05) higher at CH3 than at CL3, especially compared to other factors, but was low at CL2 and CL1 (Figure 2A). The expression of SQSTM1, which is located inside the inner membrane of the autophagosome, was similar to that of ATG13, and the expression of ATG5, which is autophagy marker, was similar to that of ATG13. The expression of another marker, MAP1LC3A, was relatively high, and its expression gradually increased from CH2 to CL3 and was highest at CL3 (p < 0.05). We also measured protein levels. The levels of SQSTM1, which binds to p62 to form the autophagosome, and p62 were high at CH3, while the protein levels of ATG5 and MAP1LC3A were high at CH3 and CL3 (Figure 2). In particular, the expression of LC3-II, a cleaved form of MAP1LC3A that is indicative of autophagosome formation, was present from CH3 to CL2.However, at CL2, LC3-I expression was low. At the CL1 (CL regression) stage, expression of activated LC3-I was observed, while expression of LC3-II was not observed (Figure 2B).
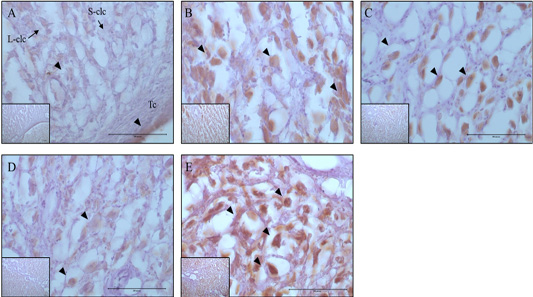
Figure 3: Expression and localization of 20α-HSD protein by luteal stage in bovine ovarian tissues. A large figure magnification X400 and small figure magnification X100. The black arrow indicates protein expression position. A: Corpus hemorrhagicum 2, B: corpus hemorrhagicum 3, C: corpus luteum 3, D: corpus luteum 2, E: corpus luteum 1, Lclc: large-corpus luteum cell, Sclc: small-corpus luteum cell, Tc: theca cell.
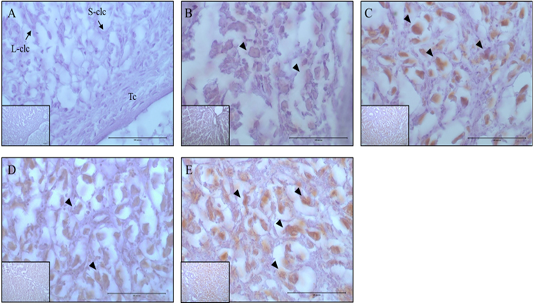
Figure 4: Expression and localization of Casp-3 protein by luteal stage in bovine ovarian tissues. A large figure magnification X400 and small figure magnification X100. The black arrow indicates protein expression position. A: Corpus hemorrhagicum 2, B: corpus hemorrhagicum 3, C: corpus luteum 3, D: corpus luteum 2, E: corpus luteum 1, Lclc: large-corpus luteum cell, Sclc: small-corpus luteum cell, Tc: theca cell.
Localization Of 20Α-Hsd And Casp-3 By Luteal Stage
The localization and expression patterns of 20α-HSD, which is a progesterone inhibiting factor, and Caspase-3 were analyzed histologically according to bovine luteal stage (Figure 3 and 4). The expression of 20α-HSD was low at the early luteal stage (CH2) in thecal luteal cells and high at the CH3 stage in large luteal cells. At the luteal stages CL3 to CL2, 20α-HSD expression decreased gradually; it was expressed in some large luteal cells, but barely expressed in small luteal cells, and at the CL1 (CL regression) stage, the expression was high in both large and small luteal cells (Figure 3). Caspase-3, which is a marker of apoptosis, was not expressed at the early luteal CH2 stage, but was weakly expressed at the later CH3 stage. At the CL3 stage, it was expressed in large luteal cells; at the CL2 stage, it was weakly expressed; and at the CL1 stage, it was expressed in large luteal cells although the expression levels were relatively low compared to that at the CL3 stage (Figure 4).
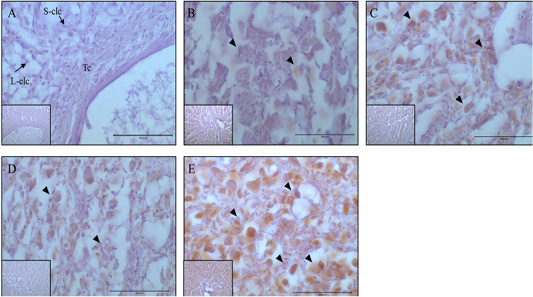
Figure 5: Expression and localization of MAP1LC3 protein by luteal stage in bovine ovarian tissues. A large figure magnification X400 and small figure magnification X100. The black arrow indicates protein expression position. A: Corpus hemorrhagicum 2, B: corpus hemorrhagicum 3, C: corpus luteum 3, D: corpus luteum 2, E: corpus luteum 1, Lclc: large-corpus luteum cell, Sclc: small-corpus luteum cell, Tc: theca cell.

Figure 6: Expression and localization of p62 protein by luteal stage in bovine ovarian tissues. A large figure magnification X400 and small figure magnification X100. The black arrow indicates protein expression position. A: Corpus hemorrhagicum 2, B: corpus hemorrhagicum 3, C: corpus luteum 3, D: corpus luteum 2, E: corpus luteum 1, Lclc: large-corpus luteum cell, Sclc: small-corpus luteum cell, Tc: theca cell.
Localization and Activity Analysis of Map1lc3a and P62 by Luteal Stage
At the CH2 stage, the expression of MAP1LC3A was generally low, whereas at the CH3 stage, it was expressed in all luteal cells, and expression increased until the CL3 stage. In contrast, in small luteal cells, MAP1LC3A was only weakly expressed. Generally, MAP1LC3A was only weakly expressed at the CL2 stage; however, it was expressed in large and small luteal cells, and at CL1 stage, it was highly expressed in all luteal cells (Figure 5). The localization and expression patterns of p62 showed similar trends to those of MAP1LC3A. At the CH2 stage, it was generally weakly expressed. At the CH3 stage, it was expressed in large luteal cells, and expression gradually increased until the CL2 stage. However, the localization of expression at the CL2 stage was different from that at the CL3 stage, and it was highly expressed in large luteal cells and weakly expressed in small luteal cells. At the CL1 stage, it was strongly expressed in large luteal cells (Figure. 6).
Discussion
After embryo implantation, the CL is maintained by placental gonadotropin hormones, and the CL produces steroids, protein hormones, growth factors, eicosanoids, cytokines, and progesterone, which affects the maintenance of pregnancy and fetal development (McCracken et al., 1999; Reynolds and Redmer., 1999; Berisha and Schams., 2005). Regression of the CL can be classified as both functional and structural. Functional regression is the sharp decrease in progesterone production induced by the expression of 20α-HSD, which inhibits progesterone production (Nakajin et al., 1989). In this study, a change in 20α-HSD levels was observed during CL development, and similar results were reported by Kim et al. (2014). During estrus, 20α-HSD levels in the CL increase in the large luteal cells from the early luteal stage (CH2) to the CH3 stage. 20α-HSD inhibits progesterone production and reorganizes granulosa cells, and at the luteal stages (CL3 to CL2) 20α-HSD levels decrease to increase progesterone production. At the CL regression stage (CL1), 20α-HSD sharply increases to induce apoptosis and control the production of progesterone in the CL (Ishida et al., 2007). Our analysis showed that the expression patterns and activity levels of genes associated with apoptosis, through inhibition of progesterone production. In the CL, the expression patterns of 20α-HSD, Casp-3 (an apoptosis marker), and markers of autophagy differed according to luteal stage. These apoptosis signals sharply control aging luteal cells via progesterone synthesis to maintain the CL (Dickson et al., 2001). At the early stage of CL development, the expression patterns of genes and proteins involved in apoptosis and autophagy, which play important roles in the structural regression of CL, were similar to or slightly different from the patterns of 20α-HSD expression. The activity of TNF and Casp-3, which induce apoptosis at the early luteal stages (CH2 and CH3) decreased, while the expression levels of autophagy-related genes were high between the CH3 and CL3 stages, since ATG5, P62, and MAP1LC3A-II, which are autophagy activating factors, began to increase substantially in thecal cells, which are transformed into luteal cells. At the CH3 stage, these autophagy genes were weakly expressed in the large luteal cells formed from already activated granulosa cells. However, at the CL3 and CL2 stage, in large luteal cells that are regressing due to aging, apoptosis-associated factors appear to be formed and are expressed in large and small luteal cells at CL1 stage. This appears to control CL function and estrus. Although some autophagy markers were observed during this process, the role of autophagy from the luteal stage to the CL regression stage seems to be minimal since MAP1LC3A-II, an autophagy marker, was not observed. From the formation to the regression of CL during the estrous cycle, through two conflicting actions (apoptosis and autophagy), luteal cells are reorganized and perform their functional roles (Skarzynski et al., 2005). Based on the results of this experiment, luteal cells are not simply reorganized by cell apoptosis but through unknown mechanisms of hormone control that affect autophagy in early luteal cells and apoptosis at later stages, and are important for the increase in hormone synthesis and reorganization of luteal cells. Therefore, suggest that the understanding these processes will be useful for general solutions to reproductive problems in animals and humans.
References


