Journal of Animal Health and Production
Research Article

Immunological and Histopathological Alterations in Rats Experimentally Infected with Trypanosoma evansi
Rasha Salah Mohammed1, Gehad Rashad Donia1, Enas Abd El-Aziz Tahoun2, Asmaa Abdallah Darwish1*
1Department of Animal and Poultry Health, Animal and Poultry Production Division, DRC, Cairo, Egypt; 2Pathology Departments, Faculty of Veterinary medicine, University of Sadat City, Egypt.
Abstract | Trypanosoma evansi is an elusive enemy for the immune system, usually resulting in high morbidities and mortalities in different dromedaries. Twenty four albino rats (12 males and 12 females) were used in this study.Samples were collected from four rats before the experiment beginning and from the rest rats weekly until the 35th day, post T. evansi intraperitoneal injection. Results showed a significant increase (P < 0.05) in the concentrations of the pro-inflammatory cytokines, acute phase proteins (APPs), free radicals, immunoglobulins, serum iron, ferritin, transferrin saturation percentage and liver enzymes and this increase was positively correlated with the experiment duration. On contrary, there was a significant decrease (P < 0.05) in the anti-inflammatory cytokine, antioxidants, trace elements, complement-3, complement-4, total iron binding capacity, unsaturated iron binding capacity and transferrin concentrations and this decrease was negatively correlated with the experiment duration. The main lesions in the examined organ sections were hyperemia, necrosis, inflammatory cells infiltration, hyperplasia and fibrosis and these lesions were more prominent in female organs than males. These results demonstrated that the immune response against T. evansi is partially implicated in the disease pathogenesis. Females are more affected by T. evansi infection than males. Moreover, both of the pro-inflammatory cytokines and APPs are sensitive markers for T. evansi infection.
Keywords | Trypanosoma evansi, Rats, Immunity, Histopathological changes, Liver enzymes
Editor | Asghar Ali Kamboh, Sindh Agriculture University, Tandojam, Pakistan.
Received | January 23, 2019; Accepted | March 06, 2019; Published | April 09, 2019
*Correspondence | Asmaa Abdallah Darwish, Department of Animal and Poultry Health, Animal and Poultry Production Division, DRC, Cairo, Egypt; Email: asmaa_vet25@yahoo.com
Citation | Mohammed RS, Donia GR, Tahoun EAE, Darwish AA (2019). Immunological and histopathological alterations in rats experimentally infected with trypanosoma evansi. J. Anim. Health Prod. 7(2): 43-50.
DOI | http://dx.doi.org/10.17582/journal.jahp/2019/7.2.43.50
ISSN | 2308-2801
Copyright © 2019 Mohammed et al. This is an open access article distributed under the Creative Commons Attribution License, which permits unrestricted use, distribution, and reproduction in any medium, provided the original work is properly cited.
Introduction
Camel is a unique animal, physiologically adapted to bear difficult environmental conditions especially drought. This makes its breeding an ideal solution for overcoming the water shortage in the next decades. Regrettably, Trypanosoma evansi is an obstacle facing camel breeding development in camel-breeding areas in Africa and Asia (Ashour et al., 2013; Eyob and Matios, 2013).
Generally, trypanosomosis is a serious protozoal infection affects a wide range of domestic animals and wild animals causing degenerative changes in various body vital organs such as brain, heart, liver, lung, spleen and kidney. T. evansi is one of its most dangerous species;mainly attacks different camel species resulting in several economic losses represented in expensive drug cost, decreased animal productivity, abortion and high mortality rates (Eyob and Matios, 2013). Besides that, it can interact with the environmental pollution and interfere with established bioindication procedures through its effect on the physiology and behavior of the host (Sures, 2004). Two forms of T. evansi disease were described in camel: the first form is acute and fatal, usually characterized by fever, weakness and anemia, while the second more common form is chronic and associated with secondary infection (Ashour et al., 2013; Eyob and Matios, 2013).
No doubt, the limited knowledge about the disease pathogenesis and the immune response against it as well as the difficulty of its detection at the first stages maximize its effects (El-Bahr and El-Deeb, 2016). Therefore, this research aimed to study the immunological and histopathological alterations associated with experimental T. evansi infection in rats and to compare between the histopathological changes of both sexes in the induced infection. Moreover, it also evaluate the value of the inflammatory cytokines and acute phase proteins (APPs) estimation in diagnosis and prognosis of T. evansi infection and their correlation with other immunological changes with special reference to its effect on the iron status as well as the liver enzymes.
Material and methods
All ethical points regarding the treatment of laboratory animals were observed in this research. Twenty-four (12 males and 12 females) albino rats (Rattus norvegicus) of 160-170 gm were used for this experiment. First, they were let to acclimate with the surroundings before the beginning of the experiment. Then, four rats (the control group (CG)): (2 males and 2 females), were anaesthetized with diethyl ether and samples (blood by cardiac puncture) were collected before the start of the experiment (0 day).
The rest twenty rats (infected rats (IR)): (10 males and 10 females) were subjected to intraperitoneal injection with 0.5ml serum of T. evansi (obtained from naturally infected camels that were diagnosed by Giemsa-stained blood smears). Samples were obtained after anesthesia with diethyl ether (blood by cardiac puncture and tissue from liver, lung, spleen) at 7th, 14th , 21st, 28th and 35th days post infection (4 rats each time, 2 males and 2 females), but the females didn`t survive until the 35th day.
Blood samples were left to coagulate and centrifugated for 20 minutes at 3000 rpm. Non-hemolysed serum was harvested and used for estimation of the immunological parameters.
The pro-inflammatory cytokines (interlukin-1α (IL-1 α), interlukin-1β (IL-1β), interlukin-6 (IL-6), tumor necrosis factor-α (TNF-α)) and the anti-inflammatory cytokines (interlukin-10 (IL-10)) serum levels were measured by ELISA kits (RayBiotech Company®). Serum amyloid A (SAA) and haptoglobin (Hp) serum concentrations were detected using ELISA kits supplied by IBL International Crop (Canda)®, serum caeruloplasmin (Cp) and transferrin (Tf) levels were evaluated by turbidimetric method using Elabscience (USA)® kits, serum ferritin concentrations were measured by CLIA method using Abnova (Taipei)®kits. Serum concentrations of free radicals ((nitric oxide (NO), malondialdehyde (MDA)), total antioxidant capacity (TAC), antioxidants (catalase (CAT), glutathione peroxidase (GPx), reduced glutathione (GSH), ascorbic acid (vit. C)), trace elements (zinc (Zn), copper (Cu)), serum iron (SI), total iron binding capacity (TIBC) and serum liver enzymatic activity (alanine transaminase (ALT), aspartate transaminase (AST), alkaline phosphatase (ALP)) were detected spectrophotometrically using commercial kits of Biodiagnostic® company. Serum levels of complement components (C3, C4) were measured by ELISA technique using commercial kits (New Test Company®). While, immunoglobulins (Igs) serum concentrations (IgG, IgM, IgA) were evaluated turbidimetrically using kits supplied by Biorex diagnostics®, UK. All methods were done according the manfacturers’ instructions. Transferrin saturation percent (TF sat. %) and unsaturated iron binding capacity (UIBC) was evaluated using following formulas:


For the histopathological examination, the tissue samples were sectioned and rapidly fixed in 10% neutral buffered formalin solution, then prepared and stained with hematoxylin and eosin according to Bancroft and Gamble (2002).
Statistical Analysis
SPSS program version 20 was used in comparing between the means of different measured parameters by one-way ANOVA test, determination of post hoc differences between means by a multiple comparison Tukey`s HSD test and in estimation of the correlation between selected parameters with Pearson’s simple correlation method. A difference was considerable significant at P< 0.05.
While, the cut off points, sensitivity, specificity and likelihood ratio (LR) for the measured cytokines and APPs were estimated between IR and CG, using graphed prism version 5 program.
The positive predictive value (PPV), negative predictive value (NPV) and accuracy rate for them is the result of dividing the number of true positive or true negative or sum of both on the number of total positive or total negative or total population respectively, then multiplied in 100.
The percentage of increase for each one of them is the result of subtracting the mean value of its concentration in CG from the mean value of its concentration in IR then, dividing the result on the mean value of protein concentration in IR multiplied in 100.
Results
Immunological Findings
Table 1 exhibited that the experimental T. evansi infection
Table 1: The effect of the experimental T. evansi infection on some innate immunity parameters. Values mean ±SD.
| Parameters | 0 day |
7th day |
14th day |
21st day |
28th day |
35th day |
|
Interlukin-1α (Pg/ml) |
22.48±1.96 | 42.74±5.79 | 61.93±5.73 | 83.27±6.70 | 97.03±4.74 | 103.40±0.01* |
|
Interlukin-1β (Pg/ml) |
26.25±3.83 | 47.00±5.62 | 68.19±3.89 | 91.88±7.38 | 100.24±5.64 | 106.30±0.01* |
| Interlukin-6 (Pg/ml) | 22.11±2.26 | 38.05±5.80 | 63.15±7.00 | 73.30±6.89 | 78.31±4.19 | 89.50±0.01* |
|
Tumor necrosis factor-α (Pg/ml) |
25.25±2.61 | 38.34±6.43 | 64.50±4.92 | 83.24±6.83 | 102.26±7.56 | 119.90±0.01* |
| Interlukin-10 (Pg/ml) | 79.51±9.24 | 58.34±5.78 | 48.57±3.91 | 41.06±6.76 | 31.70±6.56 | 28.30±0.01* |
| Caeruloplasmin (mg/dl) | 9.01±1.83 | 13.50±1.73 | 19.01±1.55 | 24.25±2.99 | 28.01±3.65 | 34.00±0.01* |
| Haptoglobin (g/dl) | 6.50±1.29 | 9.50±0.58 | 11.01±1.15 | 15.01±3.46 | 17.25±2.75 | 21.01±0.01* |
| Serum amyloid A (mg/L) | 2.28±0.20 | 2.85±0.06 | 3.16±0.14 | 3.60±0.18 | 4.55±0.13 | 4.98±0.01* |
| Malondialdehyde (nmol/ml) | 13.38±0.43 | 21.84±0.82 | 25.43±2.45 | 31.42±1.73 | 39.87±2.57 | 48.33±0.01* |
|
Nitric oxide (µmol/L) |
29.91±0.77 | 40.21±2.34 | 45.37±1.00 | 49.84±1.85 | 53.93±1.77 | 58.22±0.01* |
| Total antioxidant Capacity (Mm/L) | 1.74±0.24 | 1.31±0.17 | 0.97±0.03 | 0.80±0.8 | 0.72±0.07 | 0.69±0.01* |
| Catalase (U/L) | 416.75±34.38 | 387.00±23.12 | 317.00±46.91 | 232.50±30.57 | 201.50±13.40 | 169.00±1.41* |
| Reduced glutathione (U/L) | 11.24±0.13 | 10.98±0.17 | 10.57±0..17 | 9.80±0.25 | 8.80±0.25 | 8.42±0.01* |
| Glutathion peroxidase (mU/ml) | 955.63±28.47 | 856.85±33.92 | 760.75±32.78 | 648.63±42.82 | 542.80±32.69 | 493.10±4.38* |
|
Ascorbic acid (mg/L) |
14.95±0.82 | 13.30±1.26 | 11.41±0.96 | 9.58±0.95 | 8.85±1.21 | 7.42±0.20* |
| Zinc (µg/dl) | 116.25±8.18 | 103.50±5.51 | 94.00±5.89 | 87.50±5.51 | 83.50±6.61 | 80.00±0.01* |
| Copper (µg/dl) | 130.00±25.82 | 104.00±21.25 | 90.00±12.75 | 81.00±9.31 | 75.00±7.02 |
76.00±0.01* |
The effect of the T. evansi infection considered significant when P <0.05 and indicated by (*).
Table 2: The effect of the T. evansi infection on the serum concentrations of C3, C4, immunoglobulins, iron status and liver enzymatic activity in IR. Values mean ±SD.
| Parameters | 0 day |
7th day |
14th day |
21st day |
28th day |
35th day |
| Complement-3 (mg/dl) | 116.08±6.74 | 102.25±4.35 | 92.50±4.43 | 80.00±3.65 | 71.00±2.85 | 68.00±0.01* |
| Complement-4 (mg/dl) | 11.67±0.61 | 9.69±0.59 | 8.67±0.61 | 7.82±0.58 | 6.79±0.55 | 6.45±0.01* |
| Immunoglobulin G (mg/dl) | 187.00±6.22 | 240.00±36.51 | 277.00±39.11 | 361.00±54.69 | 418.00±47.61 | 488.00±0.01* |
| Immunoglobulin M (mg/dl) | 17.00±2.58 | 27.00±2.58 | 37.00±2.58 | 47.00±2.58 | 57.00±2.58 | 62.00±0.01* |
| Immunoglobulin A (mg/dl) | 2.34±0.38 | 2.83±0.34 | 3.93±0.46 | 4.32±0.53 | 4.73±0.58 | 5.64±0.01* |
| Serum iron (µg/dl) | 103.12±6.39 | 110.40±5.81 | 122.21±5.47 | 127.75±3.86 | 136.50±6.40 | 148.00±0.01* |
| Total iron binding capacity (µg/dl) | 300.35±5.51 | 291.88±3.75 | 280.25±1.71 | 272.75±2.21 | 269.25±1.50 | 262.00±0.01* |
| Transferrin (mg/dl) | 220.00±3.65 | 188.60±15.77 | 158.00±12.54 | 110.00±12.96 | 76.93±12.02 | 70.00±0.01* |
| Transferrin saturation % | 34.36±2.55 | 37.85±2.44 | 43.62±2.19 | 46.84±1.78 | 50.71±2.66 | 56.48±0.01* |
| Unsaturated iron binding capacity (µg/dl) | 197.23±10.63 | 181.48±9.33 | 158.04±7.04 | 145.00±6.00 | 132.75±7.89 | 114.01±0.01* |
| Ferritin (ng/ml) | 63.25±20.52 | 103.25±4.99 | 117.00±5.48 | 131.00±5.29 | 140.00±5.89 | 148.00±0.01* |
| Alanine transaminase (U/L) | 25.25±3.40 | 35.00±2.58 | 43.00±2.58 | 46.50±1.91 | 51.00±2.58 | 52.00±0.01* |
|
Aspartate transaminase (U/L) |
22.75±2.22 | 30.00±1.63 | 34.50±2.08 | 40.00±1.63 | 45.00±1.15 | 49.00±1.41* |
| Alkaline phosphatase (U/L) | 21.75±2.37 | 37.00±1.82 | 41.00±2.58 | 45.00±2.58 | 50.00±3.65 |
51.00±1.41* |
The effect of the T. evansi infection considered significant when P <0.05 and indicated by (*).
Table 3: The correlation between the experiment duration, pro-inflammatory cytokines, serum iron, ferritin and the other parameters in IR (values = r).
| Parameters | Duration | Interlukin-1α | Interlukin-1β | Interlukin-6 | Tumor necrosis factor- α | Serum iron | Ferritin |
| Duration | 1 | 0.979* | 0.969* | 0.952* | 0.981* | 0.944* | 0.906* |
| Caeruloplasmin | 0.968* | 0.977* | 0.957* | 0.964* | 0.984* | 0.979* | 0.925* |
| Haptoglobin | 0.925* | 0.946* | 0.925* | 0.923* | 0.951* | 0.956* | 0.891* |
| Serum amyloid A | 0.976* | 0.959* | 0.932* | 0.916* | 0.967* | 0.954* | 0.899* |
| Total antioxidant capacity | -0.889* | -0.890* | -0.916* | -0.888* | -0.867* | -0.812* | -0.792* |
Complement-3 | -0.965* | -0.940* | -0.935* | -0.904* | -0.928* | -0.845* | -0.854* |
| Complement-4 | -0.941* | -0.909* | -0.930* | -0.882* | -0.893* | -0.812* | -0.862* |
| Immunoglobulin G | 0.940* | 0.953* | 0.909* | 0.925* | 0.959* | 0.959* | 0.881* |
| Immunoglobulin M | 0.987* | 0.994* | 0.973* | 0.970* | 0.993* | 0.966* | 0.937* |
| Immunoglobulin A | 0.922* | 0.950* | 0.918* | 0.964* | 0.962* | 0.985* | 0.908* |
| Alanine transaminase | 0.938* | 0.925* | 0.950* | 0.915* | 0.908* | 0.815* | 0.926* |
| Aspartate transaminase | 0.981* | 0.965* | 0.976* | 0.937* | 0.960* | 0.923* | 0.936* |
| Alkaline phosphatase | 0.915* | 0.900* | 0.918* | 0.882* | 0.870* | 0.815* | 0.926* |
Statistical significance of correlations * was recorded at (P < 0.05).
Table 4: The cutoff points, sensitivity, specificity, Likelihood ratio (LR), positive predictive value (PPV), negative predictive value (NPV) and accuracy rate of the measured cytokines and AAPs in the current experiment.
| Parameters | Cutoff point | Sensitivity | Specificity | LR | PPV | NPV | Accuracy rate |
|
Interlukin-1α |
24.10 Pg/ml | 100% | 75% | 4 | 95.24% | 100% |
95.83% |
|
Interlukin-1β |
29.55 Pg/ml | 100% | 75% | 4 | 95.24% | 100% | 95.83% |
| Interlukin-6 | 24.00 Pg/ml | 100% | 75% | 4 | 95.24% | 100% |
95.83% |
|
Tumor necrosis factor-α |
71.57 Pg/ml | 100% | 75% | 4 | 95.24% | 100% | 95.83% |
| Interlukin-10 | 27.40 Pg/ml | 100% | 75% | 4 | 95.24% | 100% |
95.83% |
| Caeruloplasmin | 10.5 mg/dl | 100% | 75% | 4 | 95.24% | 100% | 95.83% |
| Haptoglobin | 7.5 g/dl | 100% | 75% | 4 | 95.24% | 100% | 95.83% |
| Serum amyloid A | 2.45 mg/L | 100% | 75% | 4 | 95.24% | 100% |
95.83% |
accompanied with a strong innate immune response, represented by the significant increase (P < 0.05) obtained in the serum concentrations of the pro-inflammatory cytokines, APPs (Cp, Hp, SAA) and free radicals in IR and the positive correlation between this increase and the infection duration (Table 3), and the significant decline (P < 0.05) reported in the serum concentrations of the anti-inflammatory cytokine, TAC, antioxidants and trace elements in IR and the negative correlation between this decline and the experiment duration (Table 3). On the other hand, a prominent inhibition of the complement system was detected in the induced T. evansi infection indicated by the significant decrease (P < 0.05) in serum concentrations of C3 and C4 in IR (Table 2) and the negative correlation between the C3, C4 and the experiment duration (Table 3). While, the significant increase (P < 0.05) noticed in the Igs serum concentrations of IR (Table 2) and the positive correlation between this increase and the infection duration (Table 3) referred to a strong humeral immune response associated the disease. In connection with the iron status and liver function tests, Table 2 demonstrated a significant increase (P < 0.05) in the serum concentrations of SI, TF sat.%, ferritin and liver enzymatic activity in IR and this increase was positively correlated with the infection duration (Table 3) on contrast, there was a significant decrease (P < 0.05) in TIBC, UIBC and TF serum concentrations in IR. Table 3 also illustrated a positive correlation between the pro-inflammatory cytokines and APPs, Igs, liver enzymes as well as a negative correlation between the pro-inflammatory cytokines and TAC, C3 and C4. A positive correlation was also recorded between the SI, ferritin and liver enzymes, APPs as well as a negative correlation between the SI, ferritin and TAC.
Table 4 exhibited that the estimated cytokines and APPs have the same sensitivity, specificity, likelihood ratio, PPV, NPV and accuracy rate as 100%, 75%, 4, 95.24%, 100% and 95.83%. Meanwhile, Table 5 exhibited that the pro-inflammatory cytokines had a better percentage of increase
Table 5: The percentage of increase of the measured pro-inflammatory cytokines and AAPs along the experiment.
| Parameters |
7th day |
14th day |
21st day |
28th day |
35th day |
|
Interlukin-1α |
90.04% | 175.49% | 270.41% | 331.63% | 359.96% |
|
Interlukin-1β |
79.05% | 159.77% | 250.01% | 281.87% | 340.95% |
| Interlukin-6 | 73.41% | 185.62% | 231.52% | 254.18% | 304.79% |
|
Tumor necrosis factor-α |
51.84% | 155.45% | 229.66% | 304.99% | 374.85% |
| Caeruloplasmin | 49.83% | 110.1% | 169.15% | 210.88% | 277.36% |
| Haptoglobin | 46.15% | 69.38% | 130.92% | 165.38% | 223.23% |
| Serum amyloid A | 25% | 38.60% | 57.89% | 99.56% |
118.42% |
than the estimated APPs; and Cp had the best percentage of increase among the measured APPs along the study. On the other hand, the percentages of increase of the pro-inflammatory cytokines were little confusing as IL-1 was the best at 7th, 21st and 28th day with percentage of increase as 90.04%, 270.41% and 331.63% respectively, and IL-6 had the highest percentage of increase at 14th day. While, TNF-α recorded the highest percentage of increase at the 35th day of the experiment.
Histopathological Alterations
The microscopic examination of the infected male and female rats` livers elucidated congestion of the central vein, portal triad and hepatic sinusoids with newly formed bile duct and infiltration by inflammatory cells, coagulative necrosis of some hepatocytes with pyknotic nuclei and hepatic sinusoid dilatation at the 7th day. These lesions markedly developed along the study duration to hepatocytes vacuolar degeneration and coagulative necrosis and reach its peak at the end of the study (Figure 1). The cytological evaluation of the experimentally infected male and female rats` lungs exposed congestion, edema of blood vessels, edematous fluid inside bronchiole, catarrhal bronchitis, slight peri-bronchial edema, inflammatory cells infiltration and alveolar emphysema at the 7th day. Gradually, these lesions increased in the severity and massive peri-bronchial lymphocytic aggregates, area of fibrosis and sever infiltration of chronic inflammatory cells and interstitial pneumonia with compensatory alveolar emphysema was observed at the 35th day (Figure 2). The stained splenic sections of the infected male and female rats showed congestion, edema and hemorrhage, depletion of white pulp at the 7th day. Then, at the 14th and 21st days: the splenic hemorrhage and depletion of white pulp increased in intensity. While, at the 28th , 35th days, the spleen showed hyperplasia in the splenic lymphoid follicles due to hyperactivity of the spleen with presence of increased number of lymphoblast cells, necrotic lymphocytes and the appearance of the giant cells, macrophage, megakaryocytes and fibrosis around large blood vessels (Figure 3). It worth to mention that, the female organs showed more sever lesions than the male organs for the same day.
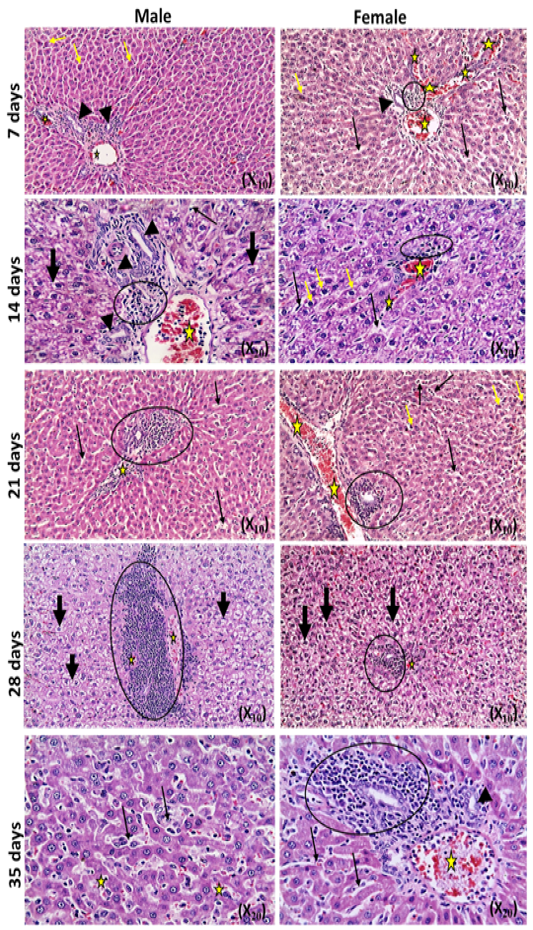
Figure 1: Photomicrographs of liver sections of male and female rats at 7th, 14th, 21st, 28thand 35thday (Haematoxylin and Eosin stain) {congestion (star); area of coagulative necrosis infiltrated with inflammatory cell infiltration (circle); pyknotic nuclei (yellow arrow); vacuolar degeneration of hepatocytes (thick black arrow); dilatation of hepatic sinusoids (thin black arrow);newly formed bile duct (head arrow) }.
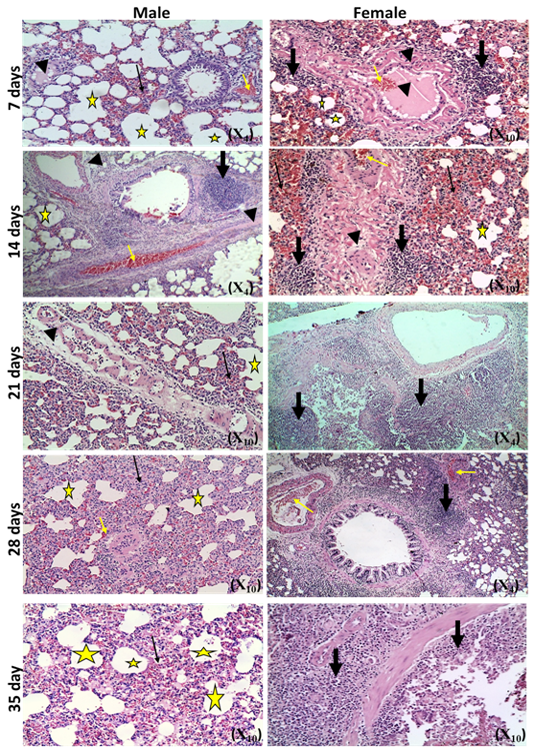
Figure 2: Photomicrographs of lung sections of male and female rats at 7th, 14th, 21st, 28th,and35thday (Haematoxylin and Eosin stain) {congestion (yellow arrow); edema (head arrow), alveolar emphysema (star); inflammatory cells infiltration (thick black arrow); thickening of interstitial tissue (thin black arrow)}.
Discussion
T. evansi is an elusive enemy for the animal immunity. It could successfully elicit a strong innate immune response in the current experiment as well as in camel naturally infected with it (Eyob and Matios, 2013; El-Bahr and El-Deeb, 2016). Whereas, the sever tissue damage produced from its migration and maturation and its DNA, stimulate the macrophages to generate the pro-inflammatory cytokines, which cooperate to initiate and exaggerate the inflammatory immune response against T. evansi infection (Eyob and Matios, 2013). Their most prominent action in this research was induction of the hepatic APPs production in IR to restore the homeostasis and hinder T. evansi propagation and diffusion until the developing of the specific immunity (El-Bahr and El-Deeb, 2016). Additionally, AAPs have a potent anti-oxidant, anti-inflammatory and bactericidal action (Schmidt and Eckersall, 2015). Free radicals liberation is another outcome from the activation of the pro-inflammatory cytokines in T. evansi infection,
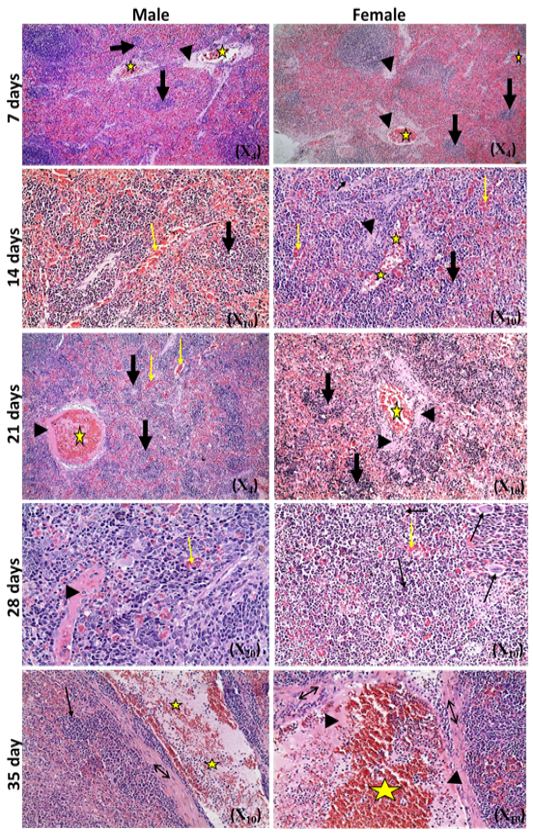
Figure 3: Photomicrographs of spleen sections of male and female rats at 7th, 14th, 21st, 28th and 35thday (Haematoxylin and Eosin stain) {congestion (star); hemorrhage (yellow arrow); vascular and perivascular edema (head arrow); depletion of white pulp (thick black arrow);
which are antimicrobial molecules generated primary from different phagocytic cells against different trypanosoma species as a part of the innate immunity of the host (Eljalii et al., 2015). Mostly, the free radicals are neutralized by antioxidant enzymes. While in the present work, they are aggregated and override the neutralizing ability of the antioxidants and start to react with host body cells, producing sever harms and different organs degeneration. Thus, the oxidative stress appears and takes a part in the pathogenesis of the disease (Baldissera et al., 2016). The decreased levels of serum Zn and Cu detected in IR here, may participated in the distinguished oxidative stress. As Zn and Cu are important cofactors, necessary for creation of different antioxidants (Eljalii et al., 2015). Unfortunately, the decreased anti-inflammatory cytokine concentrations in the current research played a leading role in the amplification of the inflammatory immune response against T. evansi and its pathogenesis (Sivangala and Sumanlatha, 2015).
The complement system is the ring that connects between the innate immunity and humeral immunity as it activated by the antigen-antibody complex. It consists of a complex series of interacting hepatic proteins, working together in a cascade fashion to facilitate the invading pathogen opsonization and phagocytosis (Lidani et al., 2017). The remarkable decrease in C3 and C4 serum levels in our data agreed withthe data described before in T. cruzi infection, as the trypanosomal proteolytic products attack the complement system and disrupt its activation (Lidani et al., 2017). In connection with the humeral immunity against T. evansi infection, the outstanding hyperimmunoglobulinemia in this experiment is a consequence for the activation of B-lymphocytes by the previously mentioned invigorated pro-inflammatory cytokines (Pays, 2006). This hyperimmunoglobulinemia were noticed before in naturally infected camels, in both acute and chronic stages of the disease (Eyob and Matios, 2013).
In consistent with these immunological changes, the histopathological examination of the organ sections demonstrated asever hyperemia, inflammatory cells infiltration, fibrosis, hyperplasia and necrosis. As the afore-mentioned activated pro-inflammatory cytokines promote the vasodilators production, which increase the vascular permeability causing these lesions (Eyob and Matios, 2013). In addition to that, the released free radicals react with different body cells causing oxidative tissue damages and destroy RBCs leading to anemic tissue damage. Furthermore, the reactive lymphocytes deposit in the lymph nodes and spleen causing their enlargement (Naessens, 2008). Thus, immune response against T. evansi participates partially in the disease pathogenesis.Similar histopathological alterations were noted before in liver and spleen of T. evansi naturally infected camels and experimentally infected mices (Abd El-Baky and Salem, 2011; Bal et al., 2012). While, the pulmonary changes in the current work are parallel to those of T. vivax experimental infection in cattle (Dagnachew et al., 2015).
Regarding the iron status, the depicted hyperfermia in IR in this study is tightly linked to the oxidative stress stated in the immunological results and the subsequent RBCs and hepatocytes destruction and release of iron and hemosiderin from them. Rationally, the high levels of serum iron is followed by enhancement of ferritin formation, increase Tf sat.% and decrease the TIBC, UIBC as well as TF serum concentrations. A similar result was reported before in human T.brucei gambiense-infection by Isaac et al. (2011). Besides that, the increased ferritin formation is a part from the acute phase response to prevent the invading pathogens from getting its iron requirements and inhibit their growth (Stijlemans et al., 2015; Stijlemans et al., 2018). These assumptions were approved by the positive correlation between the SI, ferritin and the liver enzymes and APPs as well as the negative correlation between the SI, ferritin and TAC (shown in Table 3). The increased liver enzymatic activity observed in IR in this research is also another consequence for the above-stated oxidative stress and hepatic necrotic changes (Ahmadi-hamedani et al., 2014; Hussain et al., 2016).
In connection with the comparison between the measured cytokines and APPs value in the diagnosis of the T. evansi infection, the present investigation clarified that both of them is a sensitive detector for the disease and they have equal values of sensitivity, specificity, likelihood ratio, PPV, NPV and accuracy rate. Meanwhile, the percentage of increase gave the preference for the pro-inflammatory cytokines on AAPs. Furthermore, the noticed correlation between the pro-inflammatory cytokines and other immunological parameters reflects their role in the pathogenesis of the disease and introduces them as a good target for new therapeutic programs against T. evansi. But, the fluctuating percentages of increase of the pro-inflammatory cytokines suggests that the combination between more than one of these markers will be more powerful in the early detection and evaluation of the T. evansi infection.
Conclusion
Overall, the experimental T. evansi infection evokes a prominent innate immune response as well as humeral immune response and results in several necrotic changes in liver, lung and spleen as well as dramatic changes in the iron status and liver enzymatic activity. The immune response against T. evansi is a double-edged weapon and partially implicated in the disease pathogenesis. The experimentally T. evansi infected females suffered from a higher degree of organ damages than males. Both of the pro-inflammatory cytokines and APPs are sensitive markers for T.evansi infection but for more accuracy, they should be studied in T. evansi naturally infected camels.
Conflict of interest
The authors have no conflict of interest.
Authors contribution
All authors contributed equally.
References


