Journal of Animal Health and Production
Research Article

Quantitative Analysis of Toxic Metals in Buffalo Milk Samples from Mumbai Suburban Region by ICP-AES
Ashwini Kambli1*, Sushant Sole1, Kaustubh Garud2, Snehal Lonare3, Niranjan Bagal4
1Department of Pharmacology and Toxicology, Bombay Veterinary College, Parel, Mumbai- 400012, India; 2,3,4Animal Sciences, Department of Veterinary nuclear medicine, Bombay Veterinary College, Parel, Mumbai- 400012, India.
Abstract | Presence of heavy metals in milk, particularly the non-essential ones poses a great risk to both animal and human health. Industrialization, construction, vehicle dust, heavy use of pesticides are some of the major pathways through which these metals gain access into the food chain, and eventually into the milk. The present study was conducted to determine the concentration of heavy metals in buffalo milk, owing to its high consumption in the country. Fresh, raw buffalo’s milk samples, total 100 in number were collected from different dairy farms in Mumbai suburbs. After collection, the sample were immediately kept in the freezer (-20˚C) and later processed by acid digestion method using 65% HNO3 and HClO4. Using Atomic Emission Spectrophotometry (ICP-AES), concentration of As (Arsenic), Hg (Mercury), Pb (Lead) and Cd (Cadmium) were evaluated. The results showed high levels of lead and mercury in Borivali (p<0.05)and Bhiwandi (p<0.01) region respectively. The positive values confirm presence of these toxic metals in the surrounding environment. However, no significant levels (p>0.05) of these metals were found in the water which is considered as the most common source of exposure. Also, no correlation was found between levels of heavy metals and its effect on milk yield. These results demonstrated that milk produced in the vicinity of Mumbai is contaminated with heavy metals lead and mercury; moreover environmental pollution could be a potential source of heavy metal contamination in raw milk.
Keywords | Heavy metals, Buffalo Milk, Mumbai suburbs, ICP-AES, Metal toxicity, Metals in milk
Editor | Asghar Ali Kamboh, Sindh Agriculture University, Tandojam, Pakistan.
Received | October 15, 2018; Accepted | December 18, 2018; Published | January 16, 2019
*Correspondence | Ashwini Kambli, Department of Pharmacology and Toxicology, Bombay Veterinary College, Parel, Mumbai- 400012, India; Email: ashwinivet13@gmail.com
Citation | Kambli A, Sole S, Garud K, Lonare S, Bagal N (2019). Quantitative analysis of toxic metals in buffalo milk samples from mumbai suburban region by ICP_AES. J. Anim. Health Prod. 7(1): 5-10.
DOI | http://dx.doi.org/10.17582/journal.jahp/2019/7.1.5.10
ISSN | 2308-2801
Copyright © 2019 Kambli et al. This is an open access article distributed under the Creative Commons Attribution License, which permits unrestricted use, distribution, and reproduction in any medium, provided the original work is properly cited.
INTRODUCTION
Milk is a good source of nutrition and a part of daily diet, especially vital for the growth and development of children. Accordingly, milk is consumed widely in almost all parts of India; urban as well as rural (Vinola et al., 2018). Such widespread use in daily food requires its analysis for any toxic substance. Among all the potential toxic materials that could be present in the milk, heavy metals are the ones that are of significant importance since they exhibit a wide array of hazardous impacts on human as well as animal health. The potential toxicity of metals is well understood. Acute and chronic toxicity data of all the heavy metals are well established. Moreover, several metals have emerged as human carcinogens (Farahmandkia et al., 2017).
Presence of metals in air, water, soil, and food is due to natural as well as anthropogenic activities (Beiger and Jernelov, 1986). Some heavy metals like Cu, Fe and Zn are essential to maintain proper metabolic activity in living organisms; others like Pb and Cd are non-essential and have no biological role (Qin et al., 2009). However, at high concentrations, even essential metals also cause toxicity to living organisms (Li et al., 2005).
The metals present in the milk are a result of exposure of the animal to certain factors like eating grass contaminated with metals, drinking water from contaminated sources and even the dust that settles on the grass that the animal consumes (Amponsah, 2014). The presence of heavy metals in various farm inputs, including feed, fertilizer, water and environment leads to excretion of the residues in animal’s milk (Younus et al., 2016). Heavy metals accumulate in tissues of dairy animals and ultimately excrete in milk because of their non-biodegradable and persistent nature (Burger and Elbin, 2015).
Mumbai and its surrounding regions have many buffalo farms spread in close proximity with the industrial areas, and hence have a high likelihood of exposure to environmental pollution. The produced milk is consumed locally and has a wide distribution across the city and adjacent areas. Therefore, it is imperative to know the status of heavy metals in the milk produced amongst the farms in Mumbai. Very few reports are available so far of such investigation. The aim of this study was to detect and quantify the residues of heavy metals in buffalo milk. An assessment was also done to provide a comparison between the level of metals from the water source and the milk sample from the respective farm. The generated data would help us know the status of heavy metals present in milk posing potential threat to human consumers and further guide us towards any preventive measures that need to be undertaken, for animal health as well as from the public health aspect.
MATERIALS AND METHODS
Study Area and Animals
The study area included five regions in Mumbai suburbs: Goregaon, Borivali, Thane, Bhiwandi and Kalyan (as shown in Figure 1). Area selection was done due to their close proximity to industries, highway, and construction sites responsible for heavy pollution. The dairy farms located in these areas mainly supply raw milk to many local dairies in Mumbai city and its suburbs. Five arms were selected, one from each region. From each farm, milk was taken from twenty buffaloes and the study included a total of 100 buffaloes. Detection of heavy metal concentration was carried out to assess the environmental quality for the same.
Sampling
Sterilized sampling tubes were used to avoid sample contamination. Out of twenty samples, one sample was a water sample representative of that farm, 15 samples were from the animals having average milk yield of 8-10 liters/day, and remaining 4 samples belonged to the buffaloes having a high milk yield of 14-16 liters/day. Approximately 30 ml of sample was collected from each cow and kept in an ice box during transport to the laboratory, wherein they were kept in a deep freezer (-200C) until further analysis.
Preparation of Milk Sample
Wet digestion method using acid was used to digest milk samples. 1ml of milk sample was added into crucibles containing 10 ml 65% nitric acid. They were kept on a hot plate and contents were allowed to evaporate until 1 ml of solution was left. The solution was left to cool down and later, 5 ml of per chloric acid was added to the same solution and again kept on the hot plate. White fumes were let to evaporate until 1ml solution was left in the crucible. The digest was finally diluted with deionized water up to 25 ml (Richards, 1968). The samples were further analyzed by ICP-AES (Inductively coupled plasma- Atomic Emission Spectrophotometry).The ICP-AES was available in Indian Institute of technology (IIT, Mumbai), in SAIF (Sophisticated Analytical Instrument Laboratory), where the analysis was performed. Detection limit for all the metals was 10ppb.
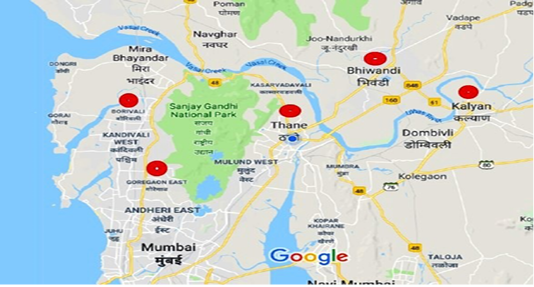
Figure 1: The study area (five regions of Mumbai were included viz., Goregaon, Borivali, Thane, Bhiwandi and Kalyan).
Calibration Curve and Validation of Method
A blank and standards (0.1, 1 and 10ppm) were run in ICP-AES and three points of calibration curve were established. Each standard solution was measured three times and the mean was plotted. The correlation coefficient of 0.99 and more showed that there is strong linear relationship between concentrations and absorbance. Concentrations of each metal were determined by interpolation from the calibration curves.
Data Analysis
Data was analyzed using Sigma Stat software 4.0. ANOVA, t-test, and Pearson correlation method were used for data interpretation. The data were expressed in term of descriptive statistics while the figures were presented with Mean values as (Mean±SD). A P-value less than 0.05 was considered as Significant.
RESULTS AND DISCUSSION
The concentrations of heavy metals in the fresh buffalo’s milk from the five regions of Mumbai suburbs are presented in Table 1. Among the four elements analyzed (As, Cd, Pb, Hg), Arsenic was below the detection limit (10ppb) of the instrument for all areas. As per the report, the highest concentration was that of Lead (0.08ppm) above the MRL (Maximum Residual Limit) (0.02ppm) from Borivali area, and Mercury (MRL=0.015ppm) level was found to be highest (0.032ppm) from Bhiwandi area. Cadmium was found in only one sample from Borivali area and its concentration (0.014ppm) was slightly above the permissible limit (0.009ppm), but not significant. Kalyan region shows levels of Lead and Mercury within limits. Samples from Goregaon contain only Lead, that too not in significantly higher concentration.
Table 1: Mean heavy metal levels in milk of buffaloes (Mean ±SE)
|
Region (N=20) |
Arsenic (ppm) |
Lead (ppm) |
Cadmium (ppm) |
Mercury (ppm) |
| Borivali | ND |
0.030± 0.003* |
0.001 | ND |
| Kalyan | ND |
0.014± 0.003 |
ND |
0.002± 0.001* |
| Goregaon | ND |
0.026± 0.001 |
ND | ND |
| Bhiwandi | ND |
0.001± 0.001 |
ND |
0.009± 0.002* |
| Thane | ND |
0.008± 0.003 |
ND |
0.010± 0.002* |
One way ANOVA was done on Sigma Stat Software (4.0). In case of Lead, significant difference was found between control (MRL) and milk samples from Borivali regions (p < 0.05). For both Lead and Mercury, there was a significant difference among the five regions (p <0.001). *Significant difference found at 5% level of significance, ND = not detected, means less than 0.01ppm.
For the present study, the average concentration of the heavy metals can be presented in the following order: Pb (0.015) > Hg (0.004)> Cd (0.002)> As (ND). The maximum permissible limit for the heavy metals under study is given in the Table 2.
Table 2: Recommended levels of heavy metals in water and milk as per WHO and Indian standards (Singh et al., 2002; Duruibe et al., 2007)
| Element |
WHO standard (in ppm)
MILK WATER |
Indian standard (in ppm) MILK | |
| Lead | 0.01 | 0.02 | 0.05-1.13 |
| Cadmium | 0.003 | 0.01 | 0.001-0.009 |
| Mercury | 0.001 | 0.001 | 0.001-0.015 |
| Arsenic | 0.01 | 0.05 | 0.001 |
Concentration of Lead in Milk Samples
It is evident from the results that Lead was found in most of the samples collected from all the five regions with an average concentration of 0.015ppm. The concentration varied from 0.019ppm to 0.08ppm. Among them, three samples from Borivali region were found in high levels, in the concentration 0.04ppm, 0.07ppm and 0.08ppm, which was statistically significant (p<0.05). Although these levels are much below the Indian standards (1.13ppm), they are almost four times higher than the International standards (0.02ppm). The rest of the samples were either within the limits or statistically non-significant.
‘
The levels in the present study match with the ones conducted by Sahayaraj and Ayyadurai (2009) where the mean concentrations of Lead excreted in milk of buffaloes in the Cooum belt and Central Cattle Breeding Farm (CCBF) of Chennai were 0.060 and 0.013 ppm respectively. The concentrations in the present study are higher than those found by Amponsah (2014) in Ghana. The mean value in his study was 0.01 ppm, and never exceeded in any of the milk samples. Birghila et al. (2008), found mean concentration of Lead in fresh cow milk as 0.12ppb, which is way too lower compared to this study.
A study on the Lead content of cow milk at Varanasi, India showed that the milk collected from an area of heavy traffic contained Lead of 0.046-0.072 ppm (Bhatia and Choudhri, 1996). These values correspond exactly to the higher values found in the present study. Therefore, closeness to the heavy traffic roads of the farms selected in this study as well may indicate towards this source of contamination.
There is no exposure level below which Lead appears to be safe. One of the major sources of Lead contamination in milk is water, especially in more contaminated areas (Codex Alimentarius Commission, 2003); so, regular water testing should be one of the important topics for future study in order to corroborate the findings of present investigation. In present study, however, contaminated feed, soil or air seems to be the most probable causes because water sample tested from the all the farms did not show high levels of lead (Table 3).
Concentration of Mercury in Milk Sample
The levels (Mean±SE) of Mercury in milk samples are given in Table 1. In the region of Borivali and Goregaon, Mercury was below the detection level (<0.01ppm). Zodape et al. (2012) found Mercury concentration in packed milk was 0.023 μg/ml(ppm), which were collected from Mumbai City, India. The level is the same as found in the present study, which is slightly higher than the Indian standards. Mercury concentration of raw cow’s milk was
Table 3: Comparison of heavy metal levels between water sample and milk sample from the respective areas
| Region | Water (ppm) | Milk (mean in ppm) | ||||||
| Lead | Arsenic | Mercury | Cadmium | Lead | Arsenic | Mercury | Cadmium | |
| Thane | 0.028 | ND | ND | ND | 0.030 | ND | 0.010 | 0.014 |
| Bhiwandi | ND | ND | ND | ND | 0.001 | ND | 0.009 | ND |
| Kalyan | 0.021 | ND | ND | ND | 0.014 | ND | 0.002 | ND |
| Goregaon | ND | ND | ND | ND | 0.008 | ND | ND | ND |
| Borivali | 0.029 | ND | ND | ND | 0.026 | ND | ND |
ND |
*The values are Mean. Correlation coefficient between milk samples and water sample was calculated using Sigma Stat Software (4.0). A sample of water from each respective farm is compared with its milk sample(n=19). Water samples from Goregaon, Borivali and Kalyan contained traces of Lead, the values of which are consistent with those found in the milk samples from these regions. For all the metals tested (Pb, Cd, Hg, As), no strong relationship was found between the two groups. ND =not detected, means less than 0.01ppm.
low in China and Japan as well (Qin et al., 2009), which was also consistent with our findings (0.01-0.032 ppm).
An important observation in a study by Jolly et al. (2017) in cow’s milk of Bangladesh was that, powdered milk contained much higher concentration of Mercury (2.4-5.2ppm) than in raw milk (0.006ppm) and packed milk (0.018-0.036ppm). Similar findings were seen with other toxic minerals. Our results were comparable to the ones in packed milk. Further processing, packaging of milk, and manufacture of milk products may be responsible for higher content of metals in powdered milk (Abdulkhaliq et al., 2012). This could be a topic to investigate further. The aforementioned study did not find the powdered milk suitable for human consumption due to alarming results. Our values are also consistent with those found by Amponsah (2014) in tin milk of Ghana. The Mercury levels ranged from 0.022 to 0.031ppm. According to international standards, these levels are higher than the permissible limit (0.001ppm), and so are the ones found in our study.
Mercury was below detection limit (<0.01ppm) in the water samples from all the farms. Therefore, it can be said that water may not be the source of contamination of this toxic metal in the milk samples studied under this investigation.
Concentration of Cadmium in Milk Samples
Cadmium was found in only one sample from Borivali region. No Cadmium was found in the water sample. Studies have showed that Cadmium concentrations in the milk of cows which have been raised in industrial areas and next to the highways or animals which are fed with food contaminated with heavy metals is much higher than of animals that are bred in cleaner areas (Pavlović et al., 2004; Patra et al., 2008). The area under present study was close to various industries, though the Cadmium was found in only one sample and the concentration (0.014ppm) was not too high. This finding is inconsistent with the literature.
Concentration of Arsenic in Milk Samples
None of the milk samples collected from the five regions showed any traces of Arsenic. Water samples, too, were negative for this metal
Concentration of Heavy Metals in Water
In the same study, a representative sample of water was collected from the respective farms to conclude whether water is the source of contamination. The results for the same are given in Table 3, and shows that water contains only traces of Lead and no other heavy metals.
A similar study was carried out by Abdalla et al. (2013) wherein a comparison was made between concentration of some heavy metals in waste water and milk (cow, goat, sheep) of animals grazing around sugar cane plants in Sudan. The study concluded that the contamination was not mainly from waste water, but from other sources such as soil containing fertilizers, pesticides, contaminated feed, traffic road intensity, etc. Although the levels of metals in water matches with our study, the levels in milk were not as high as found in this study.
A study conducted by Singare et al. (2012) shows higher levels of mercury ranging from 0.015-0.057ppm, in water samples taken from various sites in Mumbai, throughout the year. These levels accurately correspond to the Mercury levels found in milk samples in current study. However, no Mercury was found in any of the water samples in the present study; indicating that water may not be a source of heavy metal contamination in the areas under study. Values of Mercury (<0.01ppm) and Arsenic (<0.01ppm) in water are consistent to that in a research carried out by Rathod et al. (2014), in different sectors of Thane City. No significant levels of heavy metals were found. Because the Thane region was one of the five areas under study, and was negative for Arsenic and Mercury too, the data support the above findings.
As per the statistics, using Pearson correlation coefficient method, no strong relationship was found in the values of heavy metals between the water sample and the milk samples. Therefore, it cannot be said that water is the only source of heavy metal exposure in these animals.
Correlation of Milk Yield and Level of Heavy Metals
The results showing comparison between the average and heavy yield animals with respect to the heavy metal levels in their milk, to see the effect of these metals on milk yield, if any, are given in the following Table 4. Arsenic and Cadmium were not considered for comparison since they were either not detected or found in very few samples.
According to statistics, no strong inference can be made regarding effect of heavy metals on milk yield, because both high and low yielding animals are showing variable level of toxic metals. No literature can be found on this particular topic. However, chronic toxicity of heavy metals like Arsenic is associated with reduced milk yield. Future studies with large sample size, focusing solely on relation between level of toxic metals and milk yield can prove beneficial.
Table 4: Heavy metal concentration in the milk of high milk yield vs. average milk yield buffaloes
| Region | Element concentration (in ppm) | ||||
| High milk yield (n=4) | Average milk yield (n=15) | ||||
| Mercury | Lead | Mercury | Lead | ||
| Thane | 0.016 | 0.006 | 0.009 | 0.010 | |
| Bhiwandi | 0.019 | 0.005 | 0.009 | ND | |
| Kalyan | 0.007 | 0.009 | 0.001 | 0.015 | |
| Goregaon | ND | 0.023 | ND | 0.026 | |
| Borivali | ND | 0.023 | ND |
0.032 |
|
*Analysis was done using t-test in Sigma Stat Software (4.0). For both Mercury and Lead, no significant difference was found in the values from average vs. high milk yield animals at 95% confidence level. Number of animals needs to be taken into consideration. Nevertheless, in a normal farm setting, high milk yield animals are generally less in number than the entire farm population. ND = not detected, means less than 0.01ppm.
CONCLUSION
Buffalo milk samples from Mumbai suburbs were found positive for Mercury and Lead, which indicate the level of environmental pollution around the respective farms as the source of their exposure. As the sampling was done from the farms situated near the industrialized zones, speculation can be made that the industrialization might be one of the routes of the heavy metal exposure in these animals. Though few samples were positive for heavy metals, the correlation between the water sample and milk samples was negative which indicate different sources of heavy metals and their exposure.
acknowledgements
The authors express their gratitude to Department of Veterinary Pharmacology and Toxicology, Bombay Veterinary College, Mumbai for funding and supporting the research.
CONFLICT OF INTEREST
The authors declare that they have no competing interests.
authors contribution
All authors contributed equally.
REFERENCES


