Advances in Animal and Veterinary Sciences
Research Article
Adv. Anim. Vet. Sci. 3 (6): 321 - 324
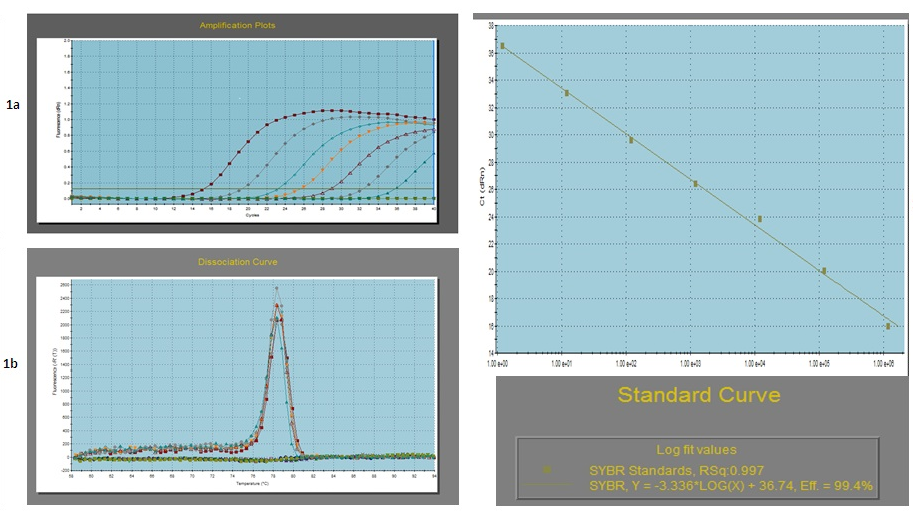
Figure 1
Real-Time RT-PCR threshold curves and limit of detection of bovine rotavirus
a- Amplification plot of the serially 10 fold diluted plasmid DNA;
b- Dissociation curve of the serially diluted plasmid DNA (Tm = 78.35 ± 0.5°C);
c- Standard curve of the serially diluted plasmid DNA


