Advances in Animal and Veterinary Sciences
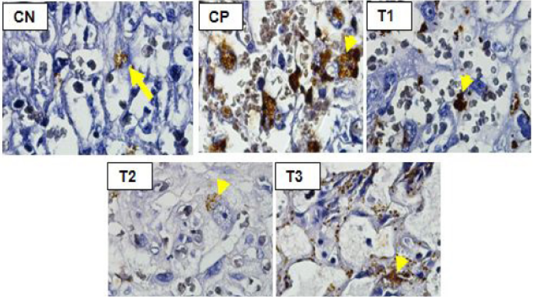
Differences in p53 expression in trophoblast cells (arrow) placenta between treatment.
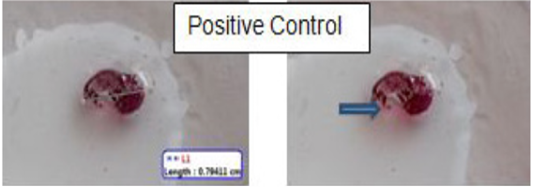
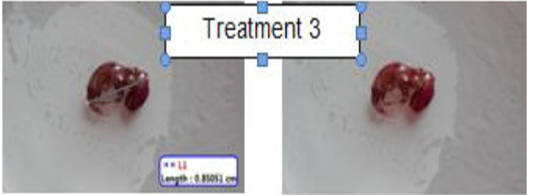
Difference in length and completeness of extremities (arrow) in foetus.
Difference in length and completeness of extremities (arrow) in foetus. The length of foetus in positive control is 0,82 cm.
Difference in length and completeness of extremities (arrow) in foetus. The length of foetus in treatment 1 is 0,86 cm.
Difference in length and completeness of extremities (arrow) in foetus. The length of foetus in treatment 2 is 1,01 cm.
Difference in length and completeness of extremities (arrow) in foetus. The length of foetus in treatment 3 is 1,44 cm.


