South Asian Journal of Life Sciences
Research Article

Spectrophotometric Estimation of Metal Ions and Nutrient Value of Formulae Milk and Baby Foods Available in Pakistan Under Different Brand Names
Amina Arif1 , Bushra Khan2 , Khizra Majeed2 , Muhammad Saqib Shahzad1, Muhammad Shahid Nadeem3, Rafique Ahmed4
1Faculty of Life Sciences, University of Central Punjab 1-Khayaban-E-Jinnah Road, Johar Town, Lahore 54000 Pakistan; 2Lahore College for Women University, Lahore 54000 Pakistan; 3Department of Biochemistry, Faculty of Science, Building No. A-90, King Abdulaziz University Jeddah 21589, Saudi Arabia; 4Govt. Kot Khawaja Saeed Teaching Hospital, Lahore, Pakistan.
Abstract | The present study describes the concentrations of contaminating trace metals like iron, copper, zinc, cobalt, nickel and magnesium; toxic metals including cadmium and lead, micro nutrients including sodium and potassium among 27 different infant milk and baby foods. The samples were analyzed by atomic absorption spectrometer prior to acid digestion. The levels of elements in analyzed samples were found to be under legal limits. Nickel concentration was found to be higher in some infant food that ranged 0.008-0.09 mg/g and in infant cereals ranged 0.005-0.01mg/g. The range of investigated metals zinc, iron, copper, cadmium, lead, sodium, potassium and magnesium, was 0.0005-0.12 mg/g, 0.002-0.13 mg/g, 0.0005-0.45 mg/g, 0.001-0.04 mg/g, 0.001-0.21 mg/g and 0.01-1-2.82 mg/g, 0.03-9.9 mg/g, and 0.01-0.046 mg/g in infant foods and cereals. The estimated intake of these metals were within recommended tolerable levels of these elements. Protein content was determined by Lowry’s method that ranged 0.02-2.1 mg/ g. Moreover, infant formulas were analyzed for the bacterial load (probiotics) and it was found that most of the products analyzed in this study contained a sufficient amount of probiotic bacteria in them. Our data can guide the parents and physicians in the selection of baby foods in Pakistan.
Keywords | Atomic absorption spectroscopy, Flame photometry, Infant formulae, Baby food, Heavy metals
Editor | Muhammad Nauman Zahid, Quality Operations Laboratory, University of Veterinary and Animal Sciences, Lahore, Pakistan.
Received | December 05, 2017 Accepted | January 25, 2018; Published | May 05, 2018
*Correspondence | Amina Arif, University of Central Punjab 1-Khayaban-E-Jinnah Road, Johar Town, Lahore 54000 Pakistan; Email: draminaarif@gmail.com
Citation | Arif A, Khan B, Majeed K, Shahzad MS, Nadeem MS, Ahmed R (2018). Spectrophotometric estimation of metal ions and nutrient value of formulae milk and baby foods available in pakistan under different brand names. S. Asian J. Life Sci. 6(1): 14-21.
DOI | http://dx.doi.org/10.17582/journal.sajls/2018/6.1.14.21
ISSN | 2311–0589
Copyright © 2018 Amina et al. This is an open access article distributed under the Creative Commons Attribution License, which permits unrestricted use, distribution, and reproduction in any medium, provided the original work is properly cited.
INTRODUCTION
The nutrient pattern has excellent value, especially in early developmental stages in pursuing a healthy body from childhood to adolescence. Infant formulae are widely used as breastmilk substitutes and play a crucial role as the main source of nutrients (Rodriguez et al., 2000; Briefel et al., 2004). Breastmilk has ideal food supplements for newborn and has retained an immensity since the ancient to modern times. Breast milk consists of ideal components like antibodies, enzymes, anti-inflammatory factors, antimicrobial agents and fatty acids which are very crucial for brain development (Van’t Land et al., 2010; Gasmalla et al., 2013). In the modern world, breast milk is replaced by milk and formula products. In these replacements, there always remains a threat for the toxicity of various contaminants and deficiency of nutrients (Demirezen and Uruç, 2006). On the other hand, the exposure to hazardous metals in the environment has affected breast milk (Chao et al., 2014; Sanders et al., 2015; Ahmad et al., 2017). The natural cow milk available on the market has the heavy metal toxicity of Lead (Pb) and Cadmium (Cd) above the permissible limits emphasizing on the need for safe food materials at an early age (Pavlovic et al., 2004; Ismail et al., 2017). Manganese is an essential element, but elevated-levels in foods can be toxic mainly for children (De Amorim et al., 2011). A prebiotic can be explained as a non- digestible food component which initiates specific changes in the activity of the gastrointestinal flora with advantageous effects on host well-being and health (Donovan and Gibson, 2009; Kristensen et al., 2016). The intake of probiotics in the follow-up formulae, and beyond early infancy, is associated with some clinical advantages, reducing the risk of gastrointestinal disorders, decreased use of antibiotics use and a lower frequency of colic irritability (Ackerberg et al., 2012). The FAO /WHO joint committee prepared guidelines for the study of the dietary intake of chemical contaminants including heavy metals. In the developing countries like Pakistan, the quality assurance system for food products is often poorly followed. The present study was aimed at screening the levels of various essential nutrients and toxic metal ions in various categories of baby foods available in the local market under different brand names.
| Milk Based Infant Formula | |
| S1 | Nan1 |
| S2 | Lactogen 1 |
| S3 | Meiji 1 |
| S4 | Similac |
| S5 | Morinaga1 |
| S6 | Nan2 pro |
| S7 | Lactogen 2 |
| S8 | Mieji 2 |
| S9 | Similac 2 |
| S10 | Nan vanilla |
| Cereal Based Baby Food | |
| S11 | Cerelac rice |
| S12 | Cerelac 3 fruits |
| S13 | Yogart+mango+orange |
| S14 | Cerelac apple and orange |
| S15 | Cerelac wheat and honey |
| S16 | Cerelac strawberry |
| S17 | Cerelac wheat |
| Mixed Adult Baby Food | |
| S18 | Horlicks wheat |
| S19 | Complan chocolate |
| S20 | Complan strawberry |
| S21 | Complan vanilla |
| S22 | Horlicks chocolate |
| S23 | Kallyg'schocos |
| S24 | Horlicks junior |
| S25 | Nidobunyad |
| S26 | bourn vita chocolate |
| S27 | Milo |
MATERIALS AND METHODS
Twenty-seven baby food samples were randomly collected from different areas in Lahore, Pakistan in their original packings. Samples were further divided into 3 groups: milk-based, cereal-based infant food and mixed baby foods. Chemicals in practice were of analytical grade.
Acid Digestion Method
All the glassware cleaned with 10% HNO3 and distilled water was used for analysis of samples. 0.2 g of each sample was weighed in triplicates and digested with 1:2 of HNO3 and H2O2 on a hot plate at 70˚C in a fume hood, till reduced to tiny amounts. Allowed to cool down and then suspended in 5 ml of 2M HNO3 after that filtered and further diluted with distilled water to make a final volume of 10 ml. The blanks were made in the same way without using any sample. The filtrate was stored in properly labeled and sealed plastic bottles. All the samples were prepared in triplicates. The metal contents were then examined by Flame Atomic Absorption spectrophotometer.
Determination of Metal Contents by Atomic Absorption Spectrophotometry
Stock solution (1000 ppm) of metals Cd, Mg, Fe, Pb, Cu, Fe, K, Na, and Zn were prepared. For calibration dilutions were made from the stock solutions at 1.00 ppm, 2.00 ppm, 3.00 ppm, 4.00 ppm, 5.00 ppm. Identification of trace elements was done by atomic absorption spectrophotometry (Aleixo and Nobrega, 2003). For each element, the accuracy, precision, selectivity, and sensitivity were verified by using Perkin Elmer Double Beam 2380 Atomic Absorption Spectrophotometer with a reference sample.
Protein Determination by Lowry’s Method
For determination of protein in the baby feed samples the method was used as explained by Waterborg (2002). Bovine Serum Albumin (BSA) was used up to plot calibration curve. Absorbance was taken at 660 nm followed by quantification with a graph plot.
Estimation of Prebiotics
Five millilitres LB (Luria-Bertani) broth (0.5 g NaCl, 0.5g yeast extract and1g of tryptone) was prepared in the test tubes and autoclaved for sterilization. Addition of 2 mg of each sample was done in these test tubes under controlled conditions, then placed in a shaking incubator for 24 hours at 37˚C for attaining maximum growth. To one set of the test tubes, antibiotic ciprofloxacin was added and the other set was kept without antibiotic. Ciprofloxacin was added for suppression of growth of bacteria other than the required one in each sample. Optical density 600 nm was measured at 1, 2, 3, 4, 5 hours of incubation using UV visible spectrophotometer.
Statistical Analysis
The data was analyzed by using Excel data sheets. The simple percentages plus mean values + SD of the heavy metals were calculated.
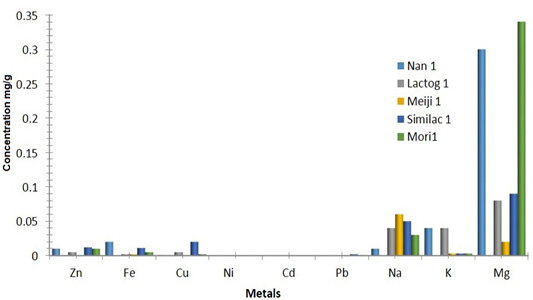
Metal Concentrations in Infant Starter Formula a and Cereal Based Baby Food
Zinc an important trace element serves as a cofactor for many enzymes. The average concentration of zinc in different starter formulations alternated between 2.3-4.1 mg/100g with highest concentrations detected in Similac1 and lowest in Lactogen1 (Figure 1A). The concentration of zinc in all investigated materials meant for 0-6 month babies was found within permissible limits. Infant foods are usually fortified with iron to meet the body’s nutritional requirements, in this study the concentration levels of iron ranged between 5.3-5.9 mg/100g with highest concentrations found in Nan 1 of 5.9 mg/100g (Figure 1A). Aluminum is a toxic metal and accumulates especially in the lungs, liver, thyroid and brain. It has been reported that infants are more susceptible to exposure to Al than adults because of their immature systems. The proposed the provisional tolerable weekly intake (PTWI) is 0.7 mg Al/100 g body weight (Sipahi et al., 2006). No Aluminum toxicity was observed in the infant formula analyses in this research. Copper concentration was different (ranging from 0.12 to 0.19 mg /100g) in different brands of milk. The highest amount was detected in Similac1 that was 0.19 mg /100g of milk. In comparison with the results of this study concentration values of copper in Similac 1 and Lactogen 1 were slightly below the recommended values (Figure 1A). Nickel was completely absent in all samples, so these samples were free from nickel (Figure 1A). Cadmium was found in very small quantities i.e. 0.01-0.07 µg /g, which are within the permissible limits in almost all of the investigated food samples. Contamination of milk samples with lead has been a serious health hazard in the past which poses a detrimental effect on the mental health of the baby, as previous studies highlighted raised levels of lead in milk samples during the manufacturing process. The major reason of contamination of cow’s milk may be due to increased exposure of lactating cows to lead to environmental pollution, consumption of contaminated food and water (Okada et al., 1997). Moreover, one of the striking revelations of raw milk contamination with lead might be its storage in metallic lead soldered cans (El-Batanoni and Abo El-Ata, 1996). The concentration levels of lead in these samples were within permissible limits imposing no danger to the infant. Sodium an essential electrolyte in the body is required to carry out proper homeostasis, as a result of the mean concentrations in different samples of this study ranged between 110-160 mg/100 g which fall within the permissible levels, with Meiji1 showing the maximum value (Figure 1A). Potassium and magnesium showed average concentration in the range of 240-450 mg/100 g and 240-450 mg/100 g respectively, with Lactogen1 having the highest concentration of potassium and Morinaga showing highest value for magnesium. Metal concentration of zinc in follow up formula ranged from 4.3-12 mg/100g, with the highest concentration of 12mg/100g found in Nan vanilla. This concentration was slightly above the permissible limits (given in Figure 1B), Nickel was not detected in any of the samples under study (Figure 1B). Cadmium and lead showed minute negligible detection (Figure 1B) favoring to a more reliable recommendation of samples for use by infants. Sodium was higher in concentration in samples of Lactogen 2, Nan vanilla and Similac 2, whereas there were lower levels of Potassium in Similac 2 and Nan vanilla (Figure 1B). Meiji 2 and Lactogen 2 have reasonable and appropriate levels of all metals.
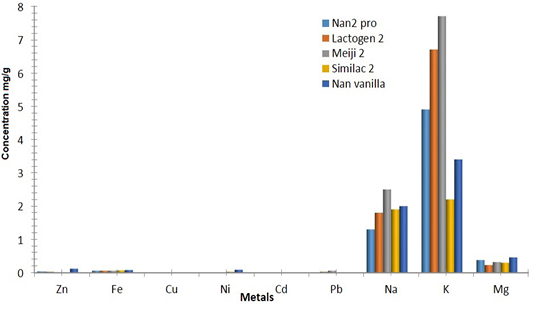
Figure 1A: Graphical representation of Metal concentrations in infant starter formula and cereal based baby food.
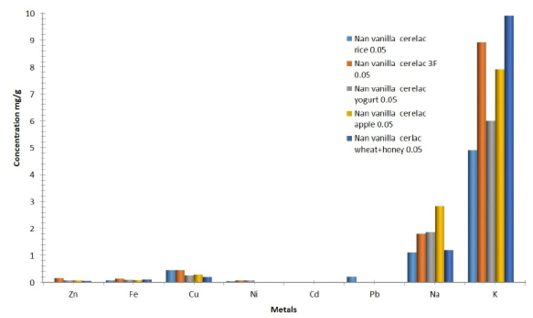
Metal Concentrations in Cereal Based Baby Food
Cereal based food gathers much attention being the major source of diet in infants possessing highly essential nutrients required by the infant which can be provided other than milk. Zinc was detected from 4.3 to 15 mg/100g in various samples, with the highest concentration found in Nan vanilla Cerelac 3 fruits and Cerelac rice with values of 9.93 and 15 mg/ 100g respectively (Figure 2). Copper is found in reasonable and permissible amounts in all the samples of Cerelac wheat and honey, Cerelac yogurt mango, Cerelac apple and orange, Cerelac 3F (Figure 2). Nickel exhibited highest value in Cerelac 3F and lowest in Cerelac wheat and honey. Sodium showed maximum concentration in Cerelac apple and orange and lowest in Cerelac rice, whereas Potassium was lower in Cerelac rice too, but increased levels were seen in samples of Cerelac wheat and honey (Figure 2).
Table 2: Recommended daily intake of metals mg/day for 0-6 and 6-12 months infants
| Sr no. | Metals | Recommended daily intake [mg/day] | |
| 0-6 months | 6-12 months | ||
| 1 | Zinc | 5.3 | 5.6 |
| 2 | Iron | 6 | 8.5 |
| 3 | Copper | 0.37-0.62 | 0.6 |
| 4 | Nickel | 0.12 | 0.12 |
| 5 | Cadmium | 0.005 | 0.005 |
| 6 | Lead | 0.003 | 0.003 |
| 7 | Sodium | 120 | 370 |
| 8 | Potassium | 700 | 800 |
| 9 | Magnesium | 36 |
53 |
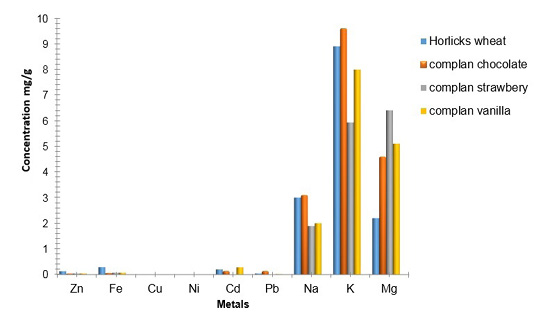
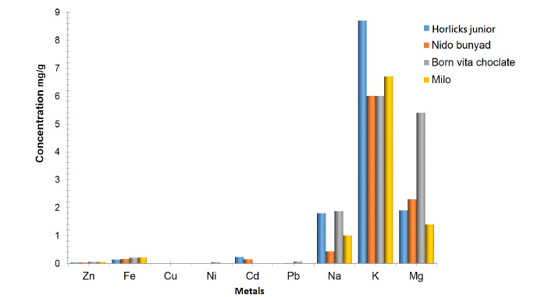
Metal Concentration in Baby Food Above 1 Year
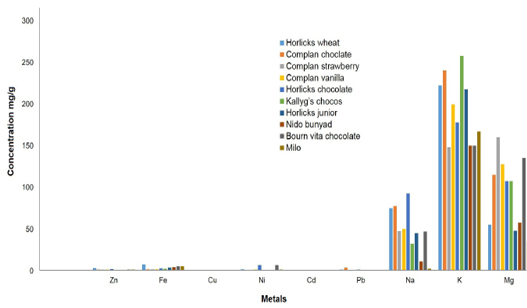
The concentration of Zinc present in baby food follows the sequence from highest to lowest in the order as Horlicks wheat, Complan chocolate, Complan strawberry, Complan vanilla, with highest in horlicks wheat of about 0.13 mg/g (Figure 3A). Iron is an essential group in the transition metals with its valued significance in the fortification of foods to meet the nutritional needs. The concentration of iron ranged between 0.6-0.29 mg /100 g, with highest concentrations in horlicks wheat of 0.29 and lowest in Complan strawberry and Complan vanilla of 0.6 mg /g (Figure 3A). Copper resulted in appropriate values for all kinds of baby food. Nickel was not identified in many samples and if reported in any study had negligible levels of consumption. Lead content was zero in milo but higher in Complan chocolate above the allowed levels (Figure 3A). Sodium ranged between 0.43-3.0 mg/ g and a much lower level of milo chocolate flavored milk (Figure 3B). Potassium showed highest levels in samples of Complan chocolate, horlicks wheat, Complan vanilla, horlicks junior and in milo and lower levels in Complan strawberry, Nido Bunyad, bornvita chocolate. In horlicks wheat and Complan strawberry potassium demonstrated a high rise with 8.9 mg/ g. Magnesium ranged from 1.9-5.4 mg/g and 6.4mg/g respectively according to this study, Figure 3A and B.
Calculation of Daily Intake of the Analyzed Metals
Mean dietary intake of infant formula was calculated by taking into consideration the age of infants. For 0-6 month’s old baby, the average consumption of infant formula is 135 g having an average weight of body 7.5 kg while the infants of 6-12 months with average weight 10 kg consume 164 g. Estimated daily intake in Nan 1, Lactogen 1, Meji1, Similac 1 and Morinaga 1 is 5.25, 4.32, 4.45, 5.53 and 3.31 mg/day respectively. Whereas suggested intake of zinc in 0-6 months old infants is 5.3 mg/day according to WHO/FAO. So, the results showed that level of zinc is in conceivable limits within these samples. The estimated intake of iron in these samples is higher than suggested intake value that is 6 mg/day. These values lie beyond the permissible level of iron. Permissible range of copper intake is 0.35-0.62 mg/day. Mieji 1 infant formula did not show the presence of lead whereas estimated intake for remaining sample is greater than suggested that is 0.005 mg/day. Sodium and potassium recommended intake is 120 mg/day and 700 mg/day for infants according to European Union. But the estimated intake is slightly greater but within the tolerated levels. Magnesium intake level is 40.5, 48.6, 52.6, 48.6 and 43.2 mg/day whereas suggested intake is 36 mg/day. Suggested intake level for 6-12 months infants is 3 mg/day. Results indicate that Nan2 pro, Lactogen2, Meiji2, Similac2 and Nan vanilla have estimated intake value of 2.6, 4.9, 3.3, 1.65, and 9.8 mg/day. Nan vanilla showed exceptionally high value .Tolerable uptake value for zinc is recommended to be 5 mg/day Lactogen 2, Nan 2 pro and Similac 2 showed lower values. The infants from 6-12 months need larger values that are accomplished by taking cereal based food having micronutrients. All the values of daily intakes of 6 months and 1-3 years infants are shown in Figure 4, 5 and 6 gives the estimated values of daily intake of metals in different age group children. Kazi et al. 2009 studied concentrations of toxic elements (TEs), aluminum (Al), cadmium (Cd), and lead (Pb) in seventeen imported samples of infant milk-based (IMF) and infant soy-based formulae (ISF). It was observed that ISF contains higher concentration of understudy toxic analytes as compared to IMF. The all three TEs, Al, Cd and Pb were detected in different branded infant formulae, in the range of (1070–2170), (10.5–34.4), and (28.7–119) g/kg, respectively. The estimated intakes of TEs as g/kg/week for infants (>1 year) through milk formulae were well below the recommended tolerable levels of these elements. Generally, there is a fortification of iron in with 12 mg/liter in infant formula. Recommended daily intake is 8.5 mg/day and tolerable uptake level is 40 mg (Devaney et al., 2004). Estimated intake of copper is higher in Nan 2 pro, lactogen 2 and Nan vanilla samples than the recommended value that is 0.6 mg/day. While adequate is provided by rest of products. Newborn recipes have less or more copper than provided by breast milk but mostly less. It is considered that ingestion of copper has less or no effect on milk copper concentrations (Lönnerdal, 1998). Nickel detection is not seen in Nan 2, Lactogen 2 and Mieji 2, while other 2 are in limits. The concentration that is achieved for sodium is larger in amount than it should be, that is 120mg/day. Potassium and magnesium has been set to the amount of 700 and 36 mg/day but the entire calculation showed higher amount for daily ingestion. The amount of zinc recommended for kids is 4.1mg/day. Zinc estimation in Complan chocolate, Complan vanilla and Complan strawberry was 1.0 mg/day on daily basis. This estimation indicates that lesser zinc is provided by these products according to our study. While other products like Kallyg’s chocos, Horlicks junior and Nido bunyad indicated much lesser ingestion values. Iron and copper have been set to level that is permissible for intake as 7 and 0.56, whereas the assessed iron intake for Horlicks wheat, Complan chocolate, Complan vanilla, Horlicks chocolate, Kallyg’s’ chocos, Nido bunyad and milo is 7.25, 1.5, 1.6, 1.6, 2.8, 2.25, 3.5, 4.0, 5.0 and 5.25 mg/day respectively and 0.13, 0.20, 0.15, 0.10, 0.08, 0.25, 0.05, 0.07, 0.17, 0.125 mg/day are the values for copper intake as shown in the Figure 5, 6, 7 respectively.
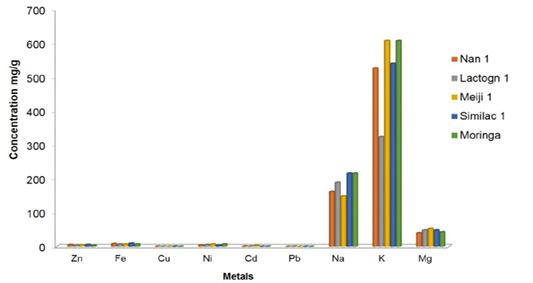
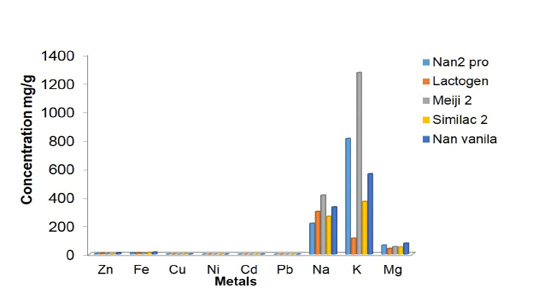
Table 3: Recommended daily intake of metals for babies above 1 year (1-3year) mg/day
| Sr no. | Metals | Recommended daily intake |
| 1 | Zinc | 4.1 |
| 2 | Iron | 7 |
| 3 | Copper | 0.56 |
| 4 | Nickel |
0.15 |
| 5 | Cadmium | 0.005 |
| 7 | Lead | 0.06 |
| 8 | Sodium | 200 |
| 9 | Potassium | 800 |
| 10 | Magnesium |
60 |
In the same way declared quantity of iron per day is also lower than allowed values. Quantity for cadmium that should be ingested per day is very small and has cut off value that is 0.005 mg/day. Complan vanilla, bournvita and milo have content of cadmium that falls in permitted quantity to be taken on a daily basis that is 0.0007,0.003 and 0.002 mg/day while others indicated higher content. There is a larger indication of eating lead through the above baby food products as the assessed values for daily consumption for Complan chocolate, Complan vanilla, Horlicks chocolate, Nido bunyad and milo are 1,3.5,0.25,0.5,1.0,0.1,0.080.34,0.65 mg/day. All these show that there is a greater risk of lead in these samples. Studies were done in China also reported raised contents of Pb, Cd, Cr, Cu, and Ni in tea which correlates with the results of the present study (Zhong et al., 2016).
Kazi et al. 2010 conducted a research in which concentrations of toxic elements, Al, Cd, Ni and Pb were measured in different baby foods. The range of the investigated TEs in different BFs were 4770–35,200, 25.6–88.3, 124–332 and 52.5–90.6 g/kg for Al, Cd, Ni and Pb, respectively. The results indicated that BFs including rice cereals have elevated level of all four TEs. The daily intakes of TEs for children through BFs have also been estimated, and are well below the recommended tolerable levels. The levels of elements in analyzed samples were found to be under legal limits.
Other metals like strontium were also analyzed in Pakistani diet which was 1.4 times higher and Ca concentration was 0.4 times lower than the recommended values of the International Commission on Radiological Protection (ICRP). Analysis of the study concluded that strontium concentration in the Pakistani diet is within the requirements whereas, the calcium concentration is insufficient for growing individuals as per international standards and needs improvement in its levels (Akhter et al., 2004). To summarize in this present study sodium and potassium content for consumption on daily basis is much lower than standard consumption value mg/day. Complan chocolate, Complan strawberry, Complan vanilla and Horlicks chocolate are much higher in magnesium mineral as they show the level of intake beyond cut off limits that are 60 mg/day.
Protein Analysis by Lowry Method
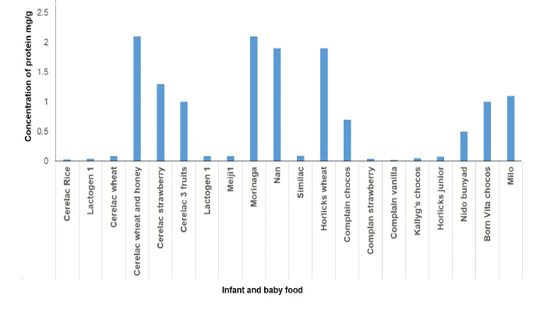
Samples were evaluated for protein by using Lowry method. Greater concentration was in Cerelac strawberry, cerelac 3 fruits, cerelac wheat but occurs in allowable measures whereas lowest is found in Cerelac rice (Figure 7). Tissue building an essential process of infancy requires a large amount of protein. The requirement of proteins for new born between 0-6 months and 6-12 months is 108 (kcal/kg) and 98 (kcal/kg) of energy respectively, on the other hand, 2.2mg/kg and 1.5mg/kg are daily required according to the weight of the individual. Metal such as cadmium, sodium and potassium are also found to have a strong link with proteins as these metal ions have a specific path through which they pass through protein channels.
Estimation of Prebiotics
Absorbance at 600 nm with antibiotic ciprofloxacin indicated bacterial growth in the samples. Cerelac wheat & honey show greater growth in the very first hour Figure 8A. While growth decreases after the first hour and remains same after that. Meiji 1 shows greater concentration at the second hour as shown in Figure 8B. Little growth was observed after 1 hour as seen in all samples in Figure 9 A and B. Whereas Nan vanilla, Cerelac strawberry shows less growth at the first hour. Absorption curves were obtained when ciprofloxacin was added that is resistant to Bifidobacterium bacteria. Ciprofloxacin allows the Bifidobacterium to grow with time but do not allow growth of other bacteria that could be present. Bacteria in the sample shows optical density in range Meiji>lactogen 1>Cerelac wheat and honey<Cerelac strawberry<Nan 1 <Cerelac wheat <Cerelac 3F<Cerelac rice as seen in Figure 8 A & B. Optical density without antibiotics showed abrupt growth of several other bacteria that can be realized by the fact that large amount of absorption is obtained just after 1 hour of incubation. They resulted in abrupt growth during the first hour which shows growth of many other bacteria. There were significant variations in the concentration levels of the understudy metals among the infant starter, follow up formulae and cereal based baby food. It is concluded that commercial complementary infant and baby foods in Lahore markets contain the minimum levels of metals required and for some metals the values are above the permissible limits. As per the labeling declaration of micronutrients and toxic metals like nickel and lead do not show their presence in many samples. Protein content was within limits in almost all samples. On the other hand, most of the infant formula products examined in this study contained the declared prebiotics in sufficient amounts.
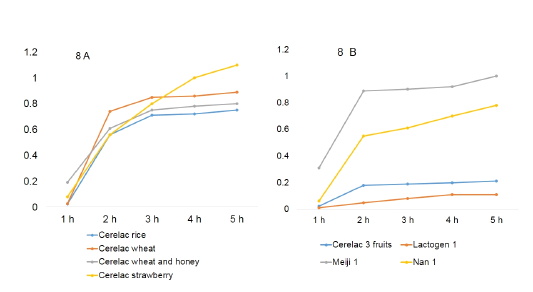
Figure 8A and B: Growth curve of bacteria in presence of ciprofloxacin.
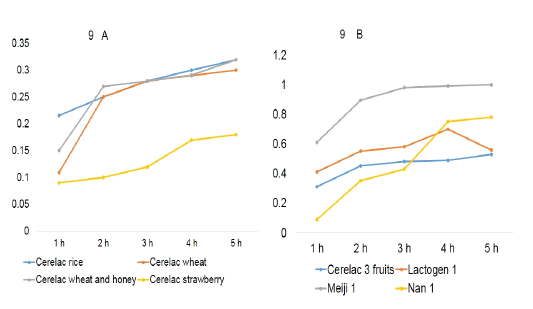
Figure 9A and B: Growth curve of bacteria in absence of ciprofloxacin
Acknowledgements
We acknowledge the Lahore college for Women University for providing practical and financial support for this research work.
Conflict of Interest
There in no conflict of interest.
Authors Contribution
Amina Arif: Planned this study.
Bushra khan: Provides Labs, chemicals, instruments for this research work
Amina Arif: Corresponding author.
Khizra Majeed: Performed practical work.
Muhammad Saqib Shahzad: Provided technical support for the practical work.
Muhammad Shahid Nadeem: Data Analysis, compiling and paper write up.
Rafique Ahmed : Proof read the paper, data analysis, compiling and paper formating.
REFERENCES