South Asian Journal of Life Sciences
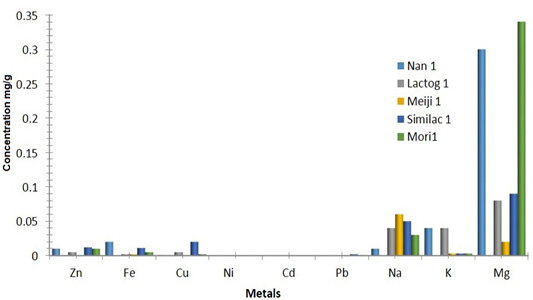
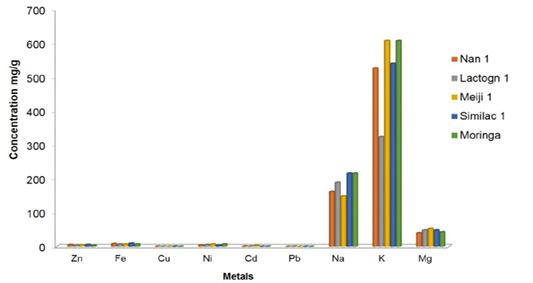
Graphical representation of Metal concentrations in infant starter formula and cereal based baby food.
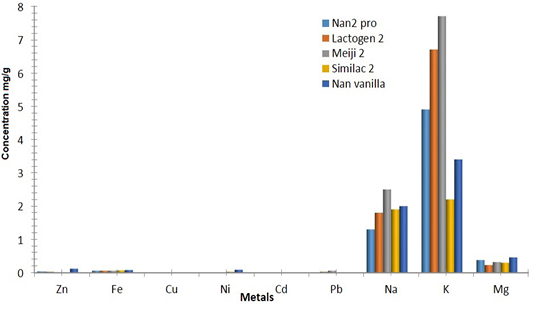
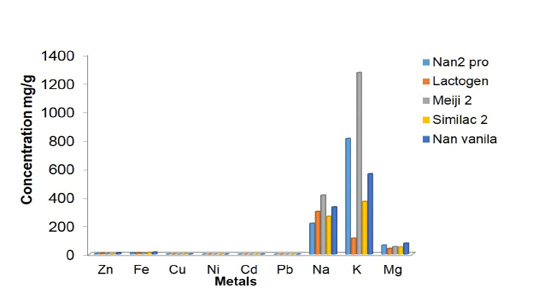
Graphical representation of metal concentrations in follow up Infant formula.
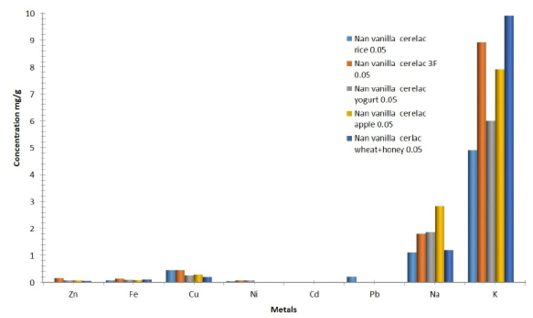
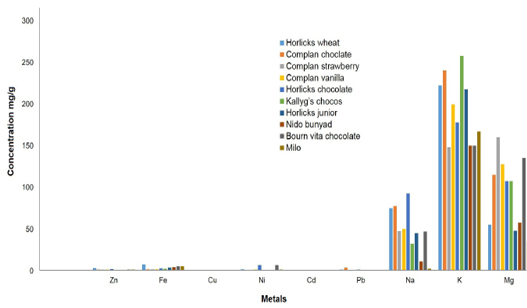
Graphical presentation of metal concentration in cereal based baby food.
Graphical presentation of metal concentration in cereal based baby food.
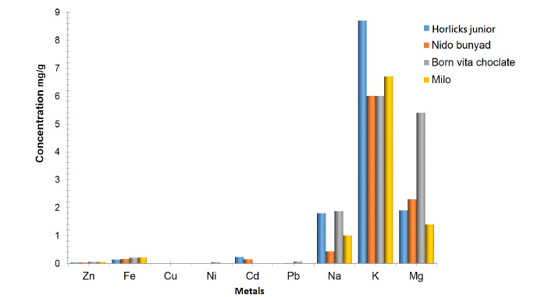
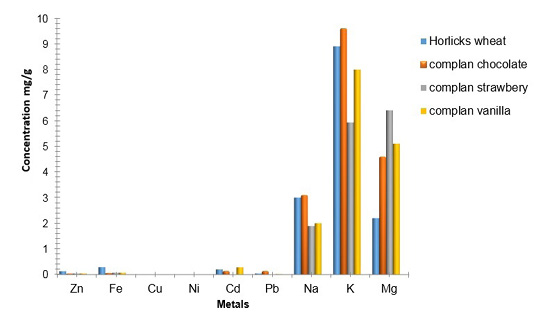
Graphical presentation of metal concentration in baby food.
Estimation of daily intake of metals mg/day for 0-6 month’s infants
Estimated daily intake of metals for 6-12months infants mg/day.
Estimated daily intake of children above 1 year (1-3 years) mg/day.
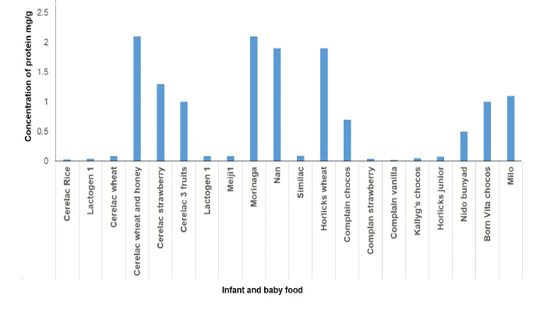
Graphical representation of the concentration of protein in infant and baby food.
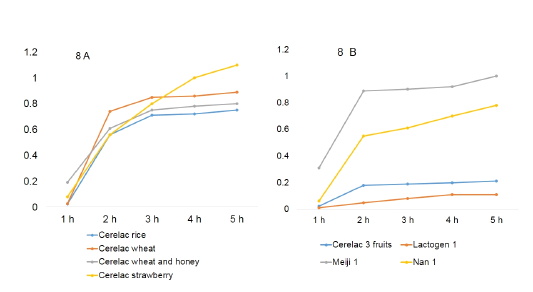
Growth curve of bacteria in presence of ciprofloxacin.
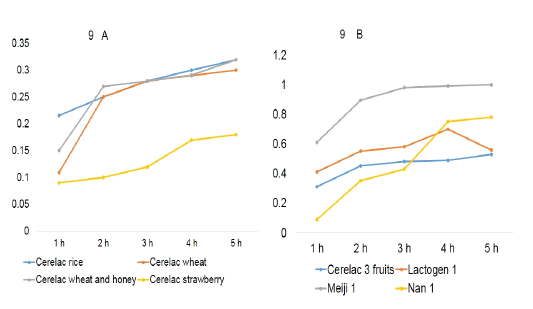
Growth curve of bacteria in absence of ciprofloxacin.


