South Asian Journal of Life Sciences
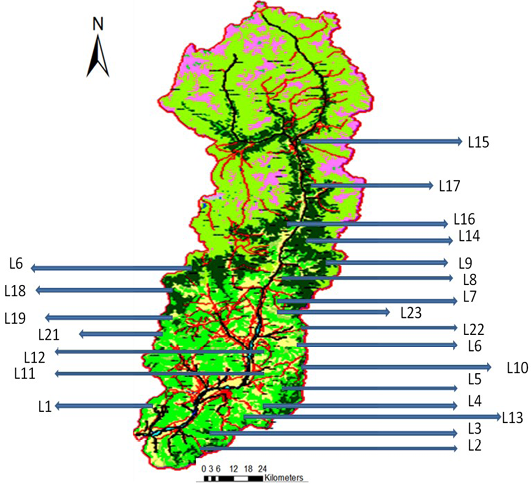
NDVI map of the Swat District: investigated locations (L1…L23; see also Table 3)
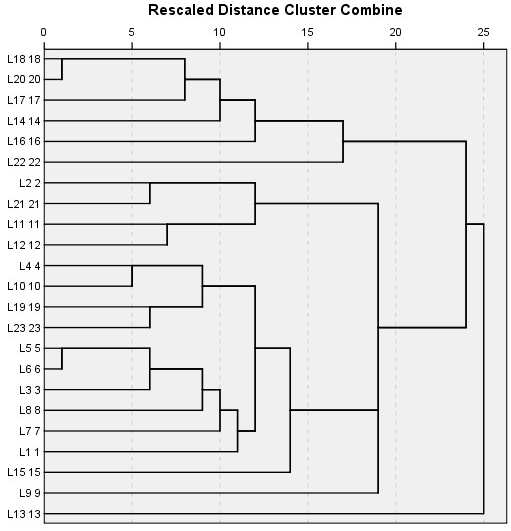
A hierarchical cluster analysis of the 23locations using average linkages method between groups. Rescaled distance measure was used as the linkage method for combining clusters
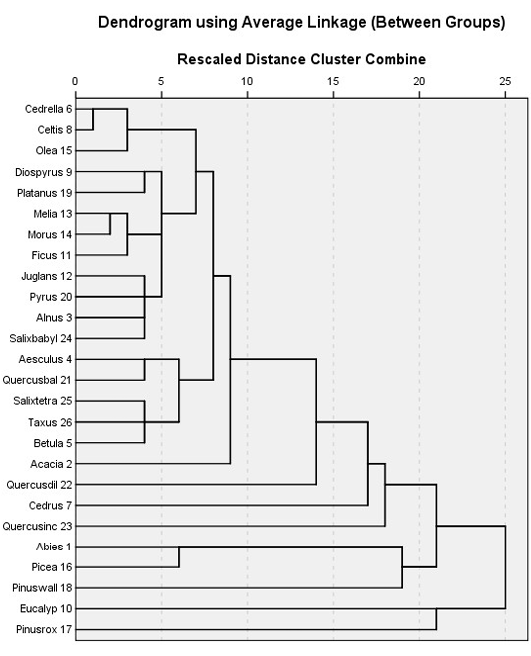
Twenty six different tree species were satisfactorily clustered into 12 groups using Chi-square between the sets of frequencies and species scores
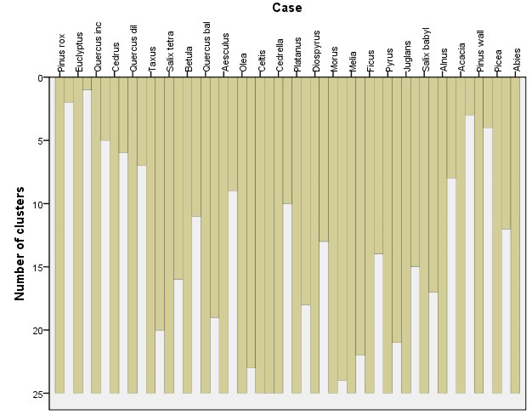
Cluster analysis (CA) of different tree species based on homogeneity/similarity of the species in the study area
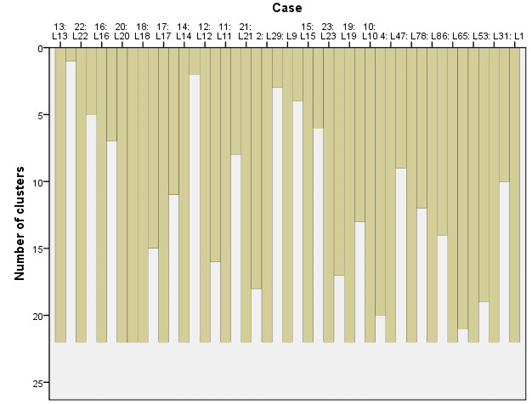
Cluster analysis of different locations based on similarity/homogeneity in the study areas
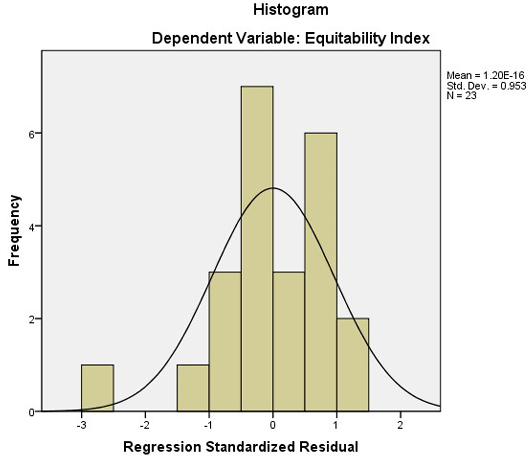
A histogram of regression model for Equitability index and average population size and number of organisms
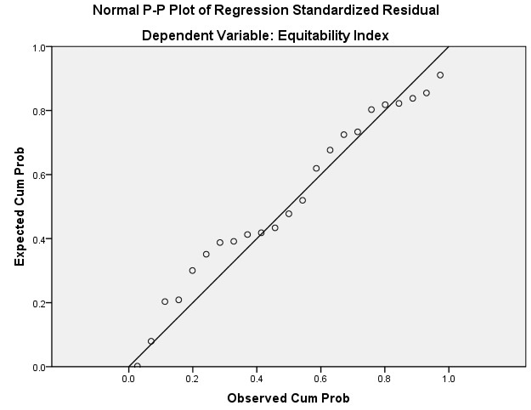
A P-P plot for Equitability index, average population size and number of organisms


