South Asian Journal of Life Sciences
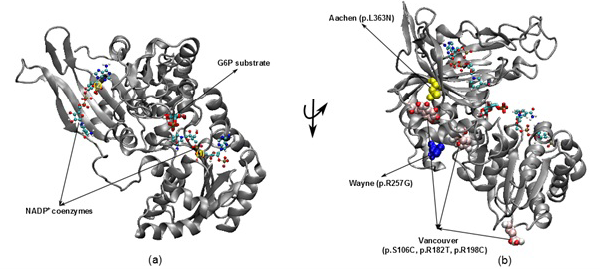
The illustration was shown the G6PD enzyme with two NADP+ coenzymes entry from 2BH9 and G6P substrate entry from 2BHL for wild type (a) and three mutants including Vancouver (p.S106C, p.R182T and p. R198C), Wayne (p.R257G) and Aachen (p.L363N) (b)
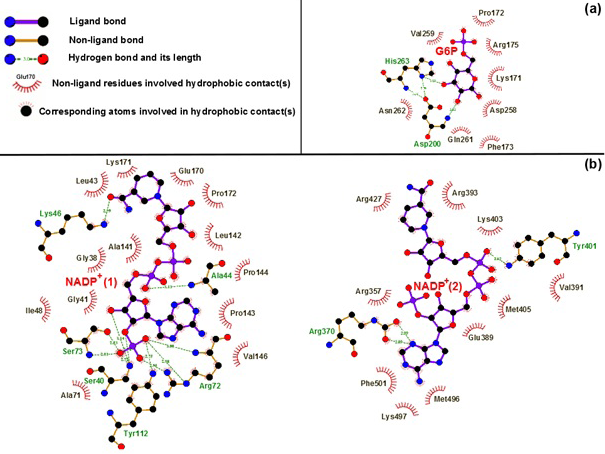
Hydrogen bond and hydrophobic interactions between G6P substrate (a), two NADP+ coenzymes (b) and the G6PD enzyme. Which was prepared by LigPlot software
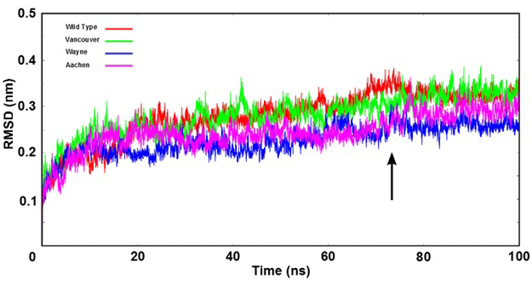
The root mean square deviation (RMSD) of backbone of the G6PD enzymes were shown as time function. Here, the arrow indicates that all systems were reached the equilibration state after 75 ns
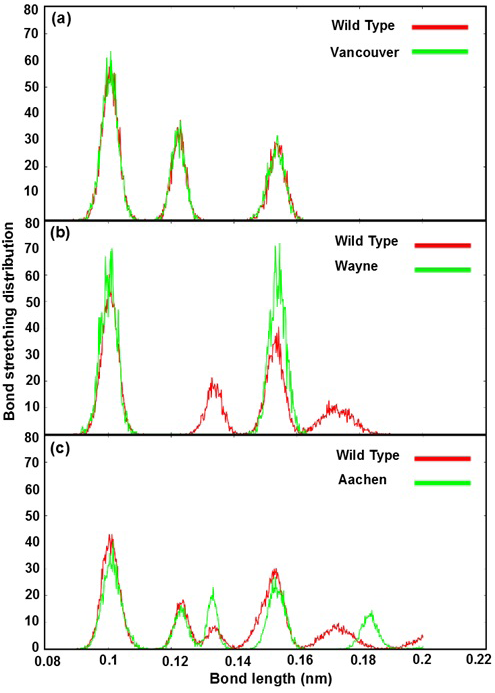
Bond stretching distribution revealed the bonding between the mutated residues and its surrounding residues as bond length function
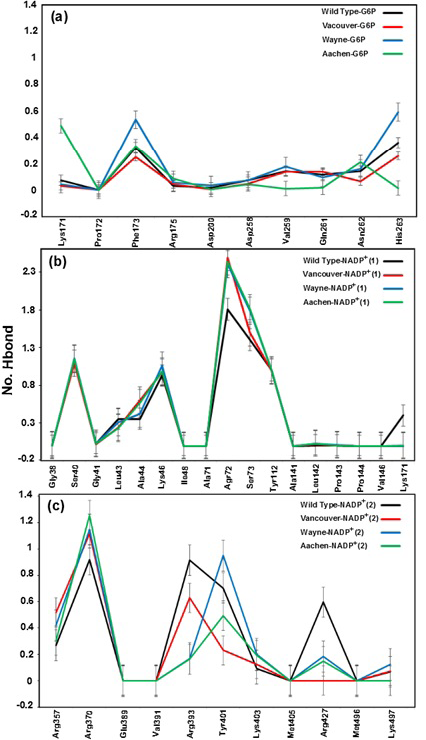
The hydrogen bonding between G6P substrate-NADP+ coenzymes and the G6PD enzymes


