South Asian Journal of Life Sciences
Research Article

Response of Eight Canola (Brassica napus L.) Verities to Different Concentrations of Saline Irrigation Water
Humaira Gul1*, Rafiq Ahmed2, Muhammad Hamayun1, Aqib Sayyed1, Shabeena1, Husna1
1Department of Botany, Abdul Wali Khan University Mardan, Pakistan; 2Biosaline Research Laboratory, Department of Botany, University of Karachi, Pakistan.
Abstract | This study was carried out in Department of Botany, University of Karachi. Eight canola varieties (Dunkled, Canola-III, Oscar, Ganyou-5, Ganyou-2, Rainbow, Abasin-95 and Westar) were used in the study. Plants were sown and subjected to control (non-saline), 0.2% (E.C 2.5 dS.m-1), 0.4% (EC 4.5 dS.m-1) and 0.6% (EC 6.5 dS.m-1) of sea salt concentrations. The aim of this study was to investigate the effect of different salinity concentrations on growth parameters [i.e. Relative growth rate (RGR), Leaf area ratio (LAR), Net assimilation rate (NAR), Leaf Weight ratio (LWR) and specific leaf area (SLA)] and different cation partitioning (Na+, K+, Ca++ and Mg++) in different plant parts of eight canola varieties. Curves for relative growth rate (RGR) calculated for fresh and dry shoot biomass, net assimilation rate (NAR), specific leaf area (SLA) and leaf weight ratio (LWR) were showed high growth rate during first fortnight period in all varieties. Significant differences in RGR were observed with salinity only in Canola-III (P<0.01) in fresh shoot biomass and Abasin-95 (P<0.05) in both fresh and dry shoot biomass. Differences of NAR and SLA with salinity were non-significant except Abasin-95 which exhibited significance at P<0.05 level. Leaf area ratio (LAR) and leaf weight ratio (LWR) exhibited increase in higher salinity in most of the varieties during first three harvests and it showed non-significant differences with salinity in all varieties except Oscar and Abasin-95 which exhibited significance at P<0.05 level. All the varieties studied in present studies showed a significant increase in the amount of Na+ in different plant parts, with increase in salinity of the external medium, except in varieties Dunkled, Canola-III and Ganyou-2 which exhibited decrease in different plant parts only at 0.2% salinity level. The amount of K+ and Ca++ in different plant parts showed reduction with increase in external salinity in present investigation in different varieties.
Keywords | Salinity, Relative growth rate, Leaf area ratio, Specific leaf area, Net assimilation rate, Leaf weight ratio
Editor | Muhammad Nauman Zahid, Quality Operations Laboratory, University of Veterinary and Animal Sciences, Lahore, Pakistan.
Received | November 01, 2014; Accepted | May 22, 2016; Published | June 12, 2016
*Correspondence | Humaira Gul, Department of Botany, Abdul Wali Khan University Mardan, Pakistan; E-mail: gulhumaira@awkum.edu.pk
Citation | Gul H, Ahmed R, Hamayun M, Sayyed A, Shabeena, Husna (2016). Response of eight canola (Brassica napus L.) verities to different concentrations of saline Irrigation Water. S. Asian J. Life Sci. 4(1): 1-17.
DOI | http://dx.doi.org/10.14737/journal.sajls/2016/4.1.1.17
ISSN | 2311–0589
Copyright © 2016 Gul et al. This is an open access article distributed under the Creative Commons Attribution License, which permits unrestricted use, distribution, and reproduction in any medium, provided the original work is properly cited.
INTRODUCTION
Salinity is a well-known problem in most of the arid and semi-arid regions of the world especially in irrigated areas. Salinity limits productivity of irrigated soils in large areas of the world (Corwin et al., 1996; Homaee et al., 2002b). It is estimated that about 7% of the land area and about 5% of agricultural land in the world has been exposed to salinity (Ghassemi et al., 1995; Flowers et al., 1997; Munns et al., 2002) which was caused by inadequate drainage, low quality irrigation water and land clearing. Saline soils contain soluble salts in quantities that affect plant growth at various stages and create yield differences between crops and in the ion composition of crops at maturity level (Sharma, 1997). The process of soil salinization and the preponderance of saline water sources point to a future reliance on salt resistant crops (Saxena, 1990; Hamdy et al., 1993; Francois and Maas, 1994).
To feed the increasing world population food production must be increased by up to 100% over the next 25 years (Borlaug and Dowswell, 1993; Dyson, 1999). This increase in food production must be achieved on the already cultivated land, because potential for expanding the area of agricultural soils is very limited. Recent trends indicate that productivity and fertility of soils are globally declining due to degradation and intensive use of soils without consideration of proper soil-management practices (Gruhn et al., 2000; Cakmak, 2002). Canola (Brassica napus L., B. rapa L., Brassicaceae) is a genetically altered form of rapeseed with low erucic acid, a 22-carbon chain fatty acid that is used in a variety of polymer and lubricant products. Interest in canola is increasing steadily among health-conscious consumers due to its lowest content of saturated fatty acids (<70 g/kg) among major oil seeds. Canola oil is now the third largest source of edible oil following soybean and palm oil (Nowlin, 1991). This increased demand, and the need for crop diversification, will undoubtedly promote increased acreage of canola in the western US, where some soils are prone to become saline (Francois, 1994). In an effort to develop the low erucic acid cultivars, the plant breeders are at the same time attempting to look for seedlings, which are tolerant to salinity. The two species of canola B. napus and B. campestris are classified as tolerant to salinity as per Maas and Hoffman (1977) salt tolerance classification table. Maas (1990) reported that even though both the species exhibit high salinity thresholds, the rate of yield decline above the thresholds was much greater than most other crops in the tolerant category. Plant relative growth rate (RGR) can be factorised into physiological and morphological components that determine the plant’s carbon economy (Lambers et al., 1989). The physiological component is the net assimilation rate (NAR) and it is a measure of whole-plant daily net rate of change in plant carbon content (McKenna and Shipley 1999; Poorter, 1989). NAR is generally correlated with the rate of photosynthesis per unit leaf area (Koningset al., 1989; Poorter and Van der Werf, 1998). The morphological component is related to amount of leaf area per plant mass or leaf area ratio (LAR), which, in turn depends on two components: specific leaf area (SLA) and a measure of biomass allocation (leaf mass ratio, LMR) (Koningset al., 1989; Poorter and Van der Werf, 1998). The objective of this study was to investigate the effect of different salinity concentrations on growth parameters and ions portioning in different plant parts of eight canola varieties.
Material and Method
Eight canola varieties namely Dunkled, Canola-III, Oscar, Ganyou-5, Ganyou-2, Rainbow, Abasin-95 and Westar were used for this experiment. Clay pots containing approximately 3Kg soil each, lined inside with plastic sheaths and having a basal outlet for drainage were used in this experiment. Three seeds of each variety were sown in 72 clay pots each filled with non-saline soil and irrigated with tap water. Seedlings were thinned to one per pot after 20 days prior to starting saline water irrigation. Different dilutions of sea salt were used in irrigation water for salinity treatment. Out of 72 pots kept for each variety 18 replicates were maintained per treatment e.g control (non-saline), 0.2% (E.C 2.5 dS.m-1). 0.4% (E.C 4.5 dS.m-1) and 0.6% (6.5 dS.m-1) sea salt concentrations. Concentrations of sea salt were gradually increased in irrigation water till it reached to the desired salinity of each treatment. Each pot was irrigated with 1.5L of tap water / salt solution twice a week.
Leaf area, fresh and dry biomass were recorded in harvested plants at one-month interval. Relative growth rate (RGR), Leaf area ratio (LAR), Net assimilation rate (NAR), Leaf Weight ratio (LWR) and specific leaf area (SLA) was calculated as outlined by Hunt (1982). This was carried out using the following equations:


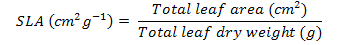
Where;
Log= natural logarithm, W2 and W1 = total plant dry weight at the beginning and the end of each harvest (g), t2 –t1 = the length of the period before each harvest (month), and LA are the total leaf areas.
Different cations (Na+, K+, Ca++ and Mg++) were estimated in different vegetative parts. Statistical analysis of the data was carried out as outlined by Little and Hills (1975) and Gomez and Gomez (1976). Data was analyzed using computer program Costat 3.03. Mean separation of data was carried out using Duncan Multiple Range test (Duncan, 1955).
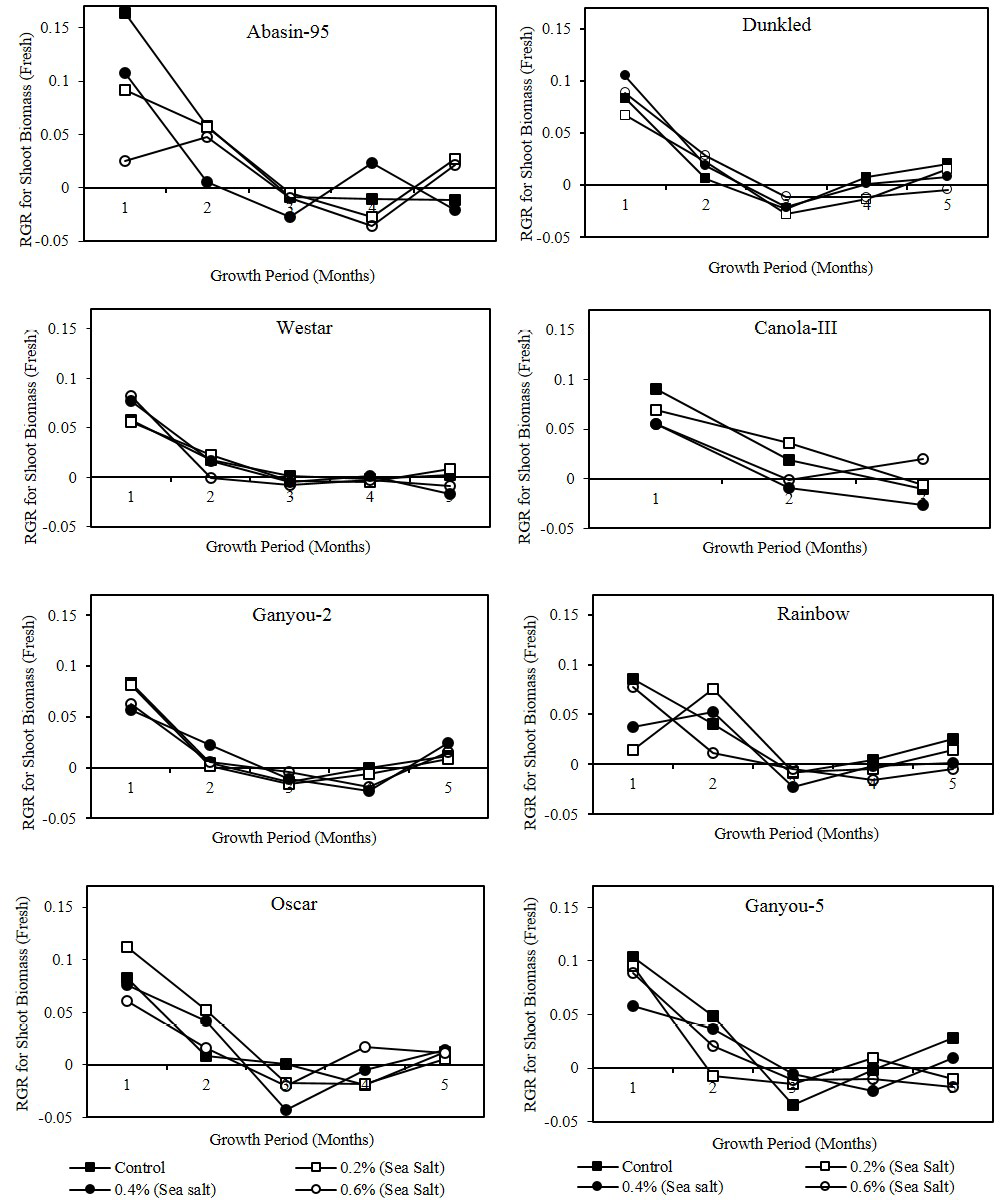
Figure 1: Effect of different levels of saline water irrigation on RGR (gm/gm/day) of fresh shoot biomass of Canola varieties
Results and Discussion
Growth analysis is a suitable tool for comparison normal growth and growth under different levels of salt stress. Growth parameters like NAR, RGR and LAR act as indicator for the sites where salt induced growth reduction takes place (Decae et al., 1995). Curves for relative growth rate (RGR) calculated for fresh and dry shoot biomass were presented in Figure 1 and 2. It showed high growth rate during first fortnight period in all varieties.
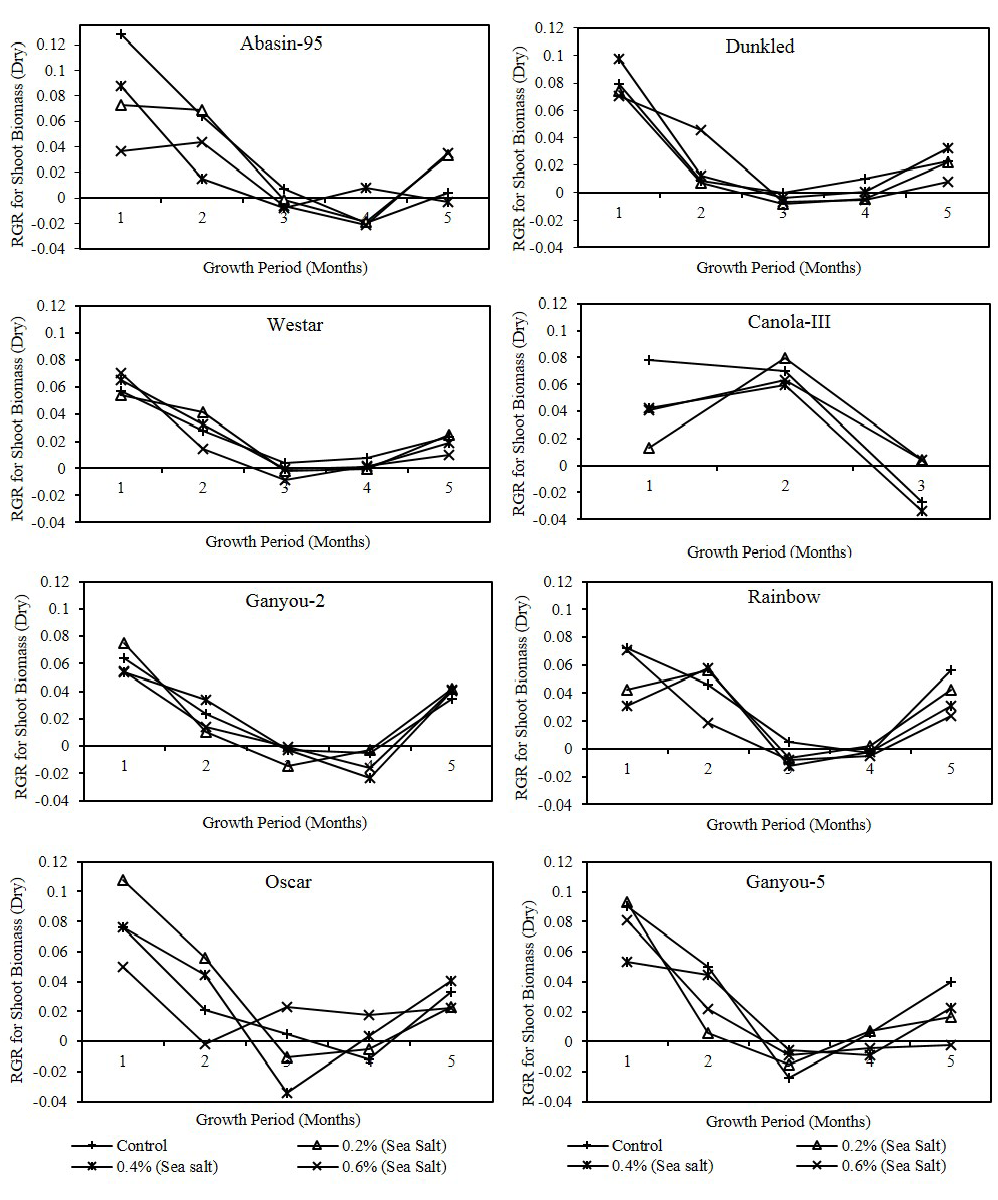
Figure 2: Effect of different levels of saline water irrigation on RGR (gm/gm/day) of dry shoot biomass of Canola varieties
In Dunkled, Oscar and Westar salinity treated plants showed high RGR values as compare to control in fresh as well as dry biomass. Statistical analysis showed that RGR on the bases of shoot biomass (fresh and dry) had significant (P<0.001) differences in all varieties except Canola-III had significant differences of dry shoot biomass at P<0.05 level with different harvest periods. Significant differences were observed with salinity only in Canola-III (P<0.01) in fresh shoot biomass and Abasin-95 (P<0.05) in both fresh and dry shoot biomass. Net assimilation rate
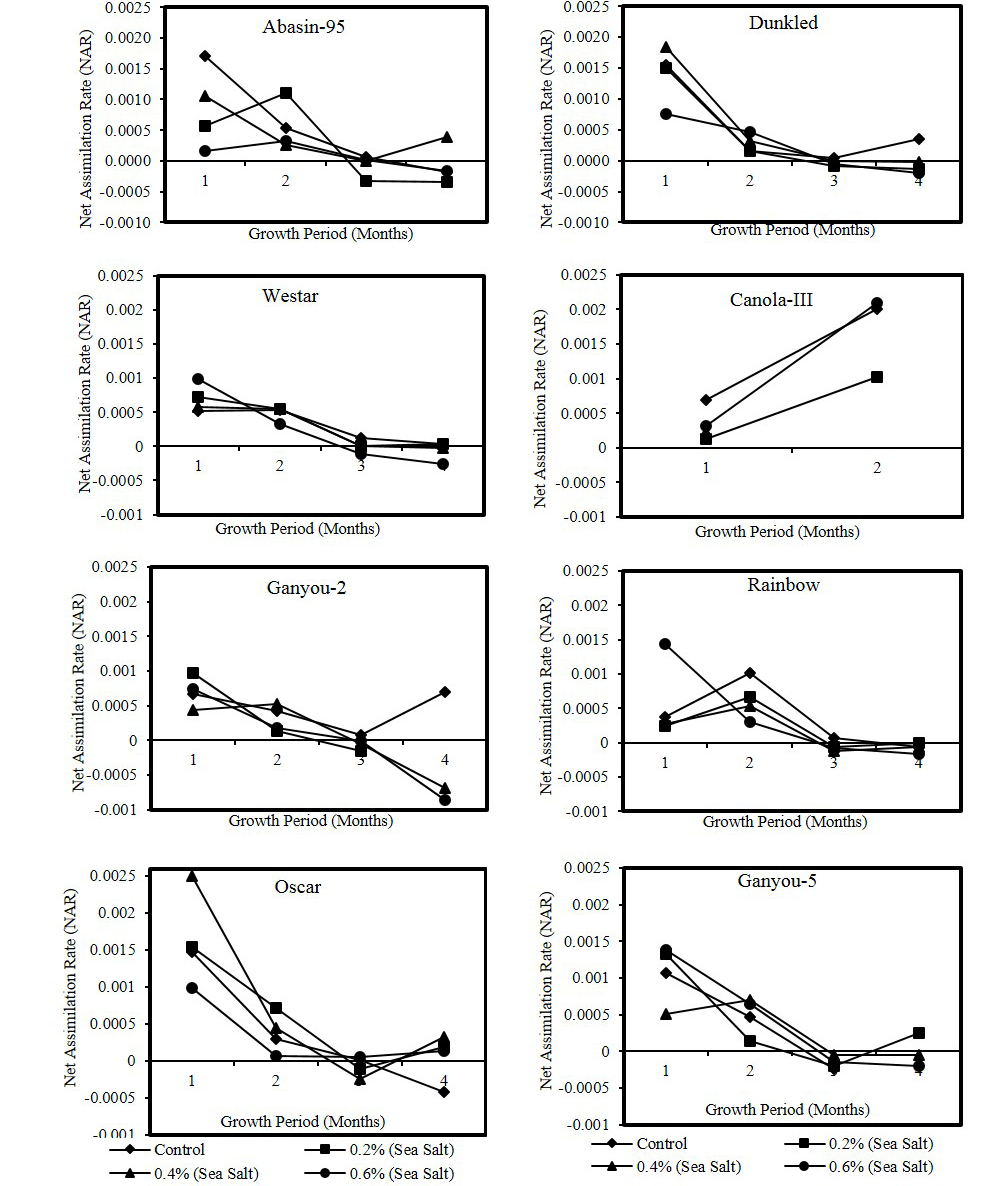
Figure 3: Effect of different levels of saline water irrigation on NAR (gm/cm2/month) Of different Canola varieties
in plants of different Canola varieties irrigated with different salinity levels is presented in Figure 3. All varieties showed more or less high values of NAR at first harvest interval irrespective of any treatment. Canola-III showed this trend at 2nd harvest period. Statistical analysis showed that differences in NAR with time were, Dunkled, Oscar, Ganyou-5and Westar at P<0.001 level, Canola-III and Rainbow at P<0.05 level and Ganyou-2 and Abasin-95 exhibited non-significant differences. Differences of NAR with salinity were non-significant except Abasin-95 which exhibited significance at P<0.05 level. Leaf area ratio in plants of different Canola varieties irrigated with different salinity levels is presented in Figure 4. Leaf area ratio (LAR) is an important component of growth rate that exhibited increase in higher salinity in most of the varieties during first three harvests. Statistical analysis showed that LAR exhibited significant differences with time in Dunkled, Oscar, Ganyou-2, Rainbow and Westar at P<0.001 level, Ganyou-5 and Abasin-95 at P<0.01 level and Canola-III at P<0.05 level, while it showed non-significant differences with salinity in all varieties except Oscar and Abasin-95 which exhibited significance at P<0.05 level. In the present study of different Canola varieties RGR decreased with increase in salinity level at all harvest periods. Rodríguez et al. (2005) found that relative growth rate (RGR) and net assimilation rate (NAR) decreased in salinity treatments, while leaf area ratio (LAR) remained unchanged. Dodd and Donovan (1999) stated that variation in RGR was correlated with NAR and not LAR. Due to increase in the photosynthetic efficiency of the plants as proved by reduced NAR, decrease in RGR can be attributed to reduced leaf area, decrease in synthesis of primary and secondary metabolites and their utilization for growth (Husain and Ismail, 1994). Values of NAR are dependent on different environmental factors including light intensity (Waring et al., 1985), nitrogen supply (McDonald, 1989; Saga and Pearcy, 1987) and difference in species (Konings et al., 1989).
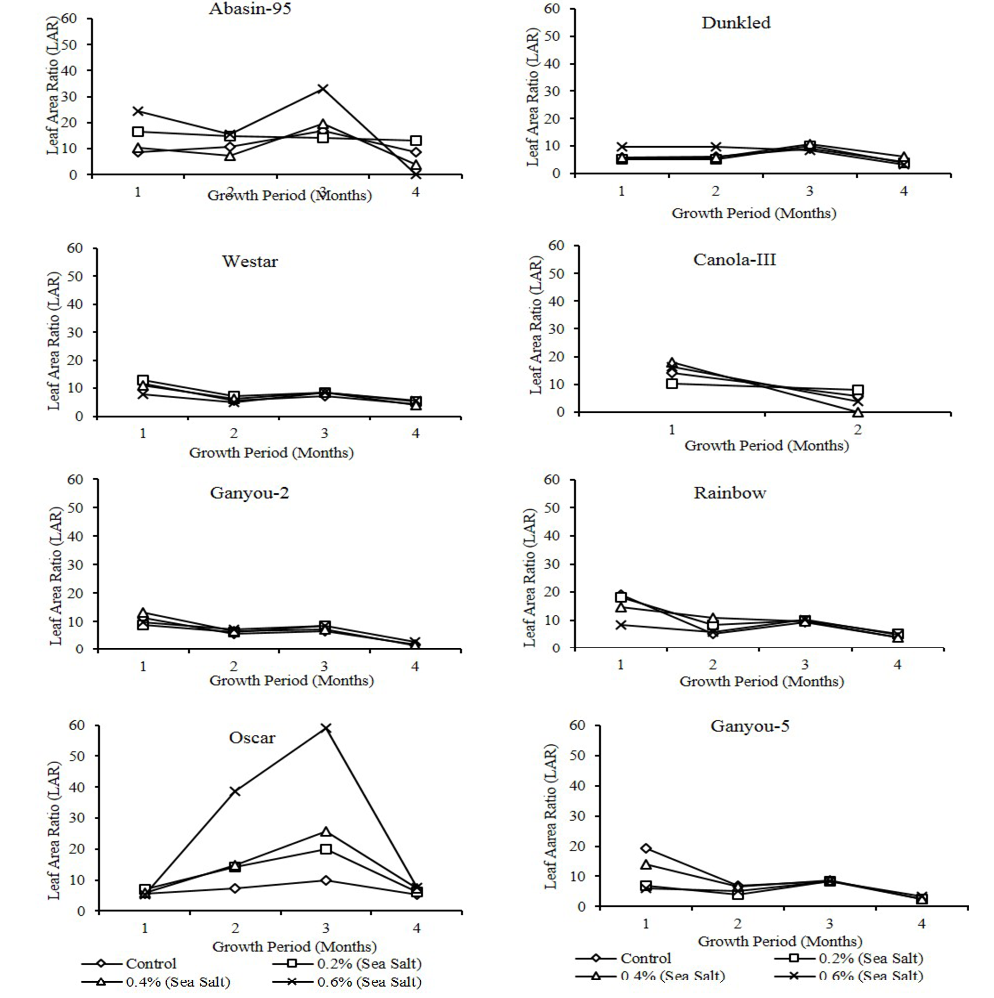
Figure 4:Effect of different levels of saline water irrigation on LAR (cm2/gm/month) of different Canola varieties
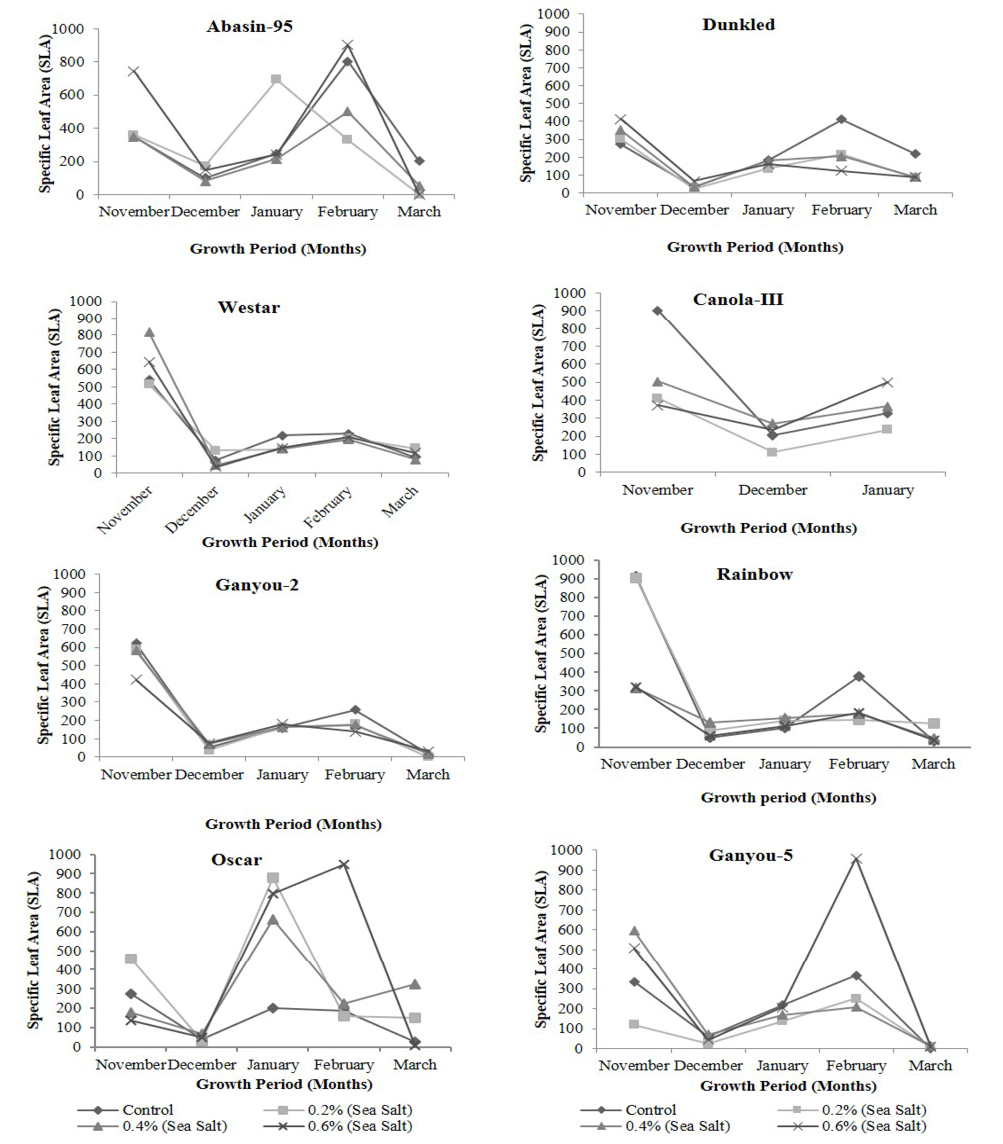
Figure 5: Effect of different levels of saline water irrigation on Specific Leaf Area (SLA) of different Canola varieties
Specific leaf area (SLA) in plants of different canola varieties irrigated with different salinity levels is presented in Figure 5. This parameter showed increase in saline as well as in control plants in 1st growth period then showed decrease in the rest growth periods. Abasin-95, Dunkled and Oscar showed increase while Ganyou-2, Ganyou-5, Rainbow, Westar and Canola-III showed decrease in this parameter at highest salinity level as compare to control. Statistical analysis showed that differences in SLA with time were significant in Oscar, Westar, Ganyou-2and Dunkled at P<0.001 level, Rainbow and Canola III at P<0.05 level and Ganyou-5 and Abasin-95 exhibited non-significant differences. Differences of SLA with salinity were non-significant except Abasin-95 which exhibited significance at P<0.05 level.
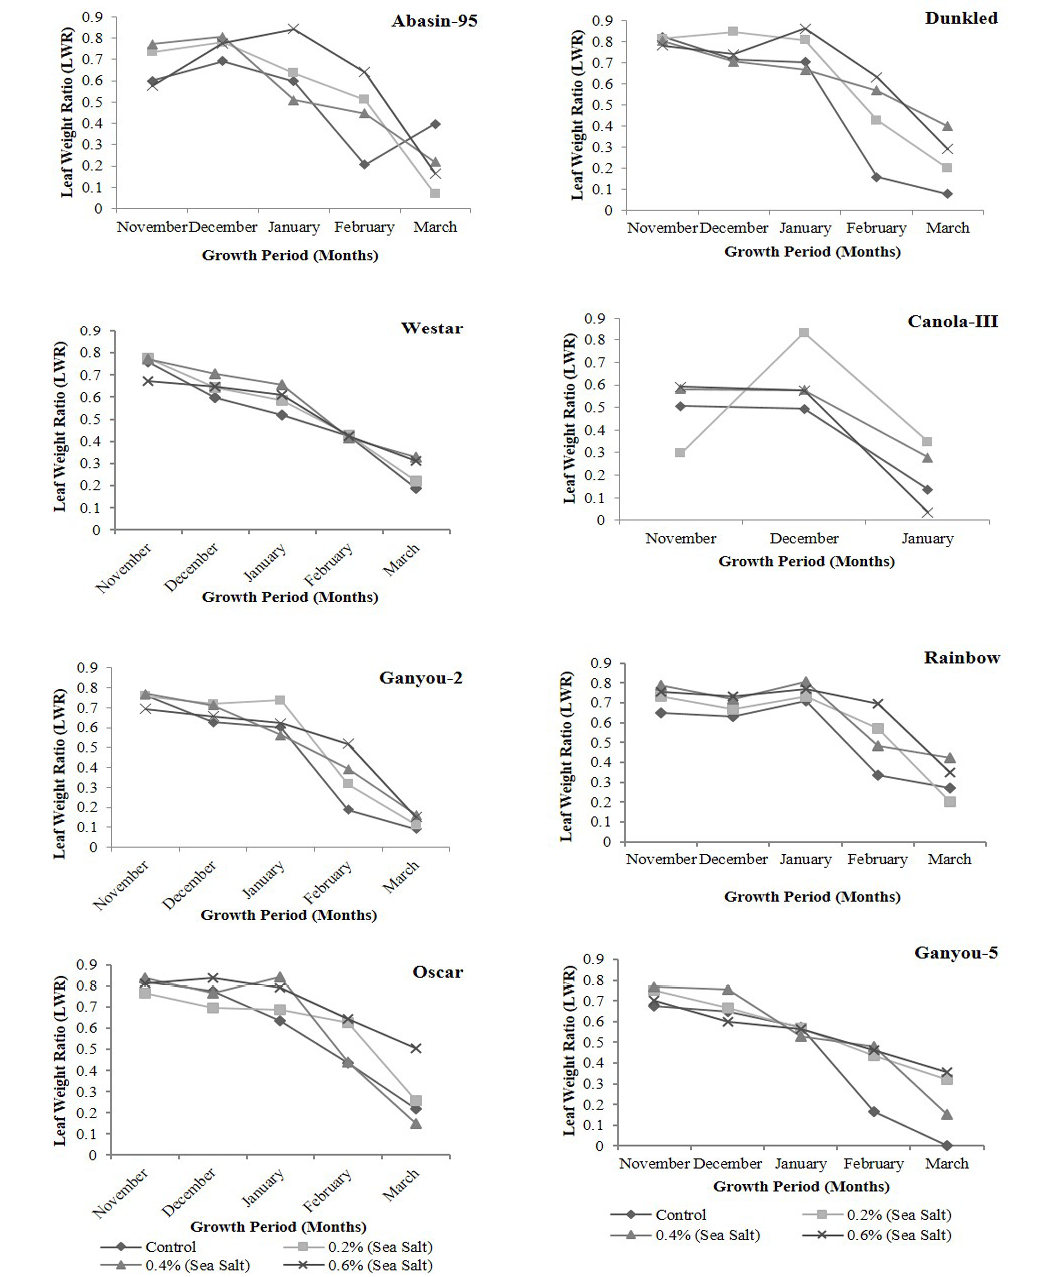
Figure 6: Effect of different levels of saline water irrigation on Leaf Weight Ratio (LWR) of different Canola varieties
Leaf Weight ratio (LWR) in plants of different canola varieties irrigated with different salinity levels is presented in Figure 6. This parameter showed increase in saline as well as in control plants in 1st growth period then showed decrease in the rest growth periods. Abasin-95, Dunkled, Ganyou-2, Ganyou-5 and Oscar showed increase while Rainbow, Westar and Canola-III showed decrease in this parameter at highest salinity level as compare to control. Statistical analysis showed that LWR exhibited significant differences with time in Dunkled, Oscar, Rainbow and Westar at P<0.001 level, Ganyou-2, Ganyou-5 and Abasin-95 at P<0.01 level and Canola-III at P<0.05 level, while it showed non-significant differences with salinity in all varieties except Oscar and Abasin-95 which exhibited significance at P<0.05 level. Ramoliya and Pandey (2002) stated that SLA of Cordia rothii was decrease in high salinity treatment. Houle et al. (2001) stated that salinity treatment had no effect on SLA, while decreasing RGR of plants due to salinity is well documented. This decrease in RGR attributing to decreasing NAR (including SLA and LWR) or LAR, varies according to plant species or age of plant or growing conditions and may be to other factors.
Ionic effects on plant is another important aspect of salt tolerance which results in inducing toxicity or help the plant in maintaining osmotic balance. Salt tolerant plants have been divided into following main groups with reference to Na+ uptake and its regulation.
Mineral composition in plant parts of different Canola varieties grown under different salinity levels of irrigation water is given in Table 1, 2, 3, 4, 5, 6, 7 and 8. Increase in salinity of irrigation medium enhanced the Na+ concentration and decreased the K+ , Ca++ and Mg++ concentration in stem, root and leaves in all the varieties. Different varieties are graded below according to the accumulation of Na+, K+ , Ca++ and Mg++ in different plant parts at 0.6% salinity level.
Sodium (Na+)
- Stem: Canola-III > Abasin-95 > Ganyou-2 > Dunkled > Westar > Ganyou-5 > Rainbow > Oscar
- Root: Canola-III > Ganyou-2 > Abasin-95 > Rainbow > Oscar > Westar > Dunkled > Ganyou-5
- Leaves: Canola-III > Rainbow > Dunkled > Ganyou-2 > Oscar > Westar > Ganyou-5 > Abasin-95
All the varieties studied in present studies showed a significant increase in the amount of Na+ in different plant parts, with increase in salinity of the external medium, except in varieties Dunkled, Canola-III and Ganyou-2 which exhibited decrease in different plant parts only at 0.2% salinity level. The high level of Na+ accumulation found in plant parts of different varieties indicate that like other Crucifers, Canola species tend to be Na+ accumulators (Francois, 1984; Francois and Kleiman, 1990). Increase of Na+ in the plant parts could be due to many reasons. i) Roots may be unable to check entry of sodium after certain concentration due to ineffective in flux mechanism under excessive sodium amendment. ii) Plant may respond to salinity by absorbing sodium and chloride at high concentrations and accumulating these ions for osmotic adjustments to the low water potential in the soil.
Potassium (K+)
- Stem: Canola-III > Oscar > Dunkled > Ganyou-2 > Westar > Abasin-95 > Rainbow > Ganyou-5
- Root: Ganyou-2 > Rainbow > Westar > Dunkled > Ganyou-5 > Canola-III > Oscar > Abasin-95
- Leaves: Ganyou-5 > Oscar > Canola-III > Rainbow > Westar > Dunkled > Ganyou-2 > Abasin-95
The amount of K+ in different plant parts either showed reduction with increase in external salinity or exhibited non-significant differences. He and Cramer (1992) observed the reduction in K+ concentration under salinity. Leidi et al. (1991) observed that concentration of K+ was reduced in wheat by increasing the concentration of NaCl in the solution in shoots. High concentrations of Na+ in the rooting medium of plants have been reported having an antagonistic effect on K+ uptake (Greenway and Munns, 1980; Jeschke, 1984).
Calcium (Ca++)
- Stem: Ganyou-2 > Abasin-95 > Ganyou-5 > Canola-III > Rainbow > Westar > Dunkled > Oscar
- Root: Ganyou-5 > Rainbow > Canola-III > Abasin-95 > Westar > Ganyou-2 > Dunkled > Oscar
- Leaves: Canola-III > Oscar > Ganyou-5 > Rainbow > Ganyou-2 > Abasin-95 > Dunkled > Westar
The concentration of Ca++ in general showed decrease with increase in salinity of the external solution and it exhibited in present investigation in different varieties. Tissue Ca++, cytosolic Ca++ and Ca++ influx are reduced under salinity conditions (Cramer et al., 1994; Lynch and Lauchli, 1988). Ca++ concentration exhibited 14% increase only in the leaves of var. Canola-III under high salinity level. It plays an important role in increasing salt tolerance of biological membranes and their permeability (Kent and Lauchli, 1985). The role of Ca++ for the maintenance of K+ transport and K/Na selectivity in plasmamembrane under saline condition has also been reported (Cramer et al., 1987; Nakamura et al., 1992; Martiz and Lauchli, 1993; Colmer et al., 1994).
Magnessium (Mg++)
- Stem: Ganyou-5 > Canola-III > Abasin-95 > Ganyou-2 > Rainbow > Dunkled > Westar > Oscar
- Root: Abasin-95 > Westar > Ganyou-5 > Ganyou-2 > Rainbow > Oscar > Dunkled > Canola-III
- Leaves: Canola-III > Oscar > Dunkled > Ganyou-5 > Ganyou-2 > Westar > Rainbow > Abasin-95
Table 1: Cation composition of Dunkled Canola variety grown at different salinity levels
|
Treatments |
STEM |
ROOT |
LEAVES |
||||||
|
Na+ |
K+ |
K+/Na+ |
Na+ |
K+ |
K+/Na+ |
Na+ |
K+ |
K+/Na+ |
|
|
-----Meq/L----- |
-----Meq/L----- |
------Meq/L------ |
|||||||
|
Control |
11.303a |
4.304a |
0.381 |
9.275a |
4.603a |
0.496 |
9.130 b |
7.800 a |
0.854 |
|
+1.094 |
+0.112 |
+1.045 |
+0.195 |
+0.752 |
+0.851 |
||||
|
0.2% (S.S) |
11.158a |
4.390a |
0.393 |
9.999a |
3.154ab |
0.315 |
16.521 ab |
7.331 a |
0.444 |
|
+1.917 |
+0.861 |
+1.094 |
+0.709 |
+0.251 |
+0.592 |
||||
|
(-1.283) |
(+1.99) |
(+7.81) |
(-31.47) |
(+80.953) |
(-6.013) |
||||
|
0.4% (S.S) |
14.202a |
3.409a |
0.240 |
11.73a |
2.77ab |
0.236 |
20.434 a |
5.626 ab |
0.275 |
|
+2.318 |
+0.697 |
+0.250 |
+0.444 |
+4.039 |
+0.778 |
||||
|
(+25.64) |
(-20.79) |
(+26.562) |
(-39.81) |
(+123.819) |
(-27.872) |
||||
|
0.6% (S.S) |
15.217a |
4.304 a |
0.283 |
11.738a |
3.196 b |
0.272 |
22.318 a |
4.134 b |
0.185 |
|
+0.251 |
+0.112 |
+1.094 |
+0.461 |
+4.953 |
+0.855 |
||||
|
(+34.62) |
0.000 |
(+26.562) |
(-30.55) |
(+144.447) |
(-47.000) |
||||
|
LSD0.05 |
5.236 |
1.826 |
3.071 |
1.590 |
10.502 |
2.533 |
|||
|
Treatments |
STEM |
ROOT |
LEAVES |
|||
|
Ca++ |
Mg++ |
Ca++ |
Mg++ |
Ca++ |
Mg++ |
|
|
Control |
4.075 a |
3.426 a |
3.077 a |
3.289 ab |
3.087 a |
3.289 a |
|
+0.463 |
+0.493 |
+0.220 |
+0.237 |
+0.212 |
+0.237 |
|
|
0.2% (S.S) |
3.575 a |
2.466 ab |
2.411 ab |
3.700 a |
2.587 ab |
1.918 a |
|
+0.440 |
+0.474 |
+0.166 |
+0.628 |
+0.171 |
+0.274 |
|
|
(-12.254) |
(-28.002) |
(-21.634) |
(+12.506) |
(-16.175) |
(-41.674) |
|
|
0.4% (S.S) |
2.910 ab |
3.015 a |
1.995 bc |
2.055 b |
1.995 bc |
2.877 a |
|
+0.440 |
+0.137 |
+0.381 |
+0.628 |
+0.381 |
+1.034 |
|
|
(-28.581) |
(-11.996) |
(-31.142) |
(-37.509) |
(-35.353) |
(-12.506) |
|
|
0.6% (S.S) |
2.245 b |
1.644 b |
1.413 c |
1.781 b |
1.579 c |
2.878 a |
|
0.000 |
+0.237 |
+0.166 |
+0.136 |
+0.166 |
+1.087 |
|
|
(-44.900) |
(-52.014) |
(-54.068) |
(-45.850) |
(-48.068) |
(-12.496) |
|
|
LSD0.05 |
1.264 |
1.203 |
0.813 |
1.515 |
0.811 |
2.518 |
Table 2: Cation composition of Canola-III variety grown at different salinity levels
|
Treatments |
STEM |
ROOT |
LEAVES |
|||||||
|
Na+ |
K+ |
K+/Na+ |
Na+ |
K+ |
K+/Na+ |
Na+ |
K+ |
K+/Na+ |
||
|
------Meq/L------- |
------Meq/L------ |
------Meq/L------ |
||||||||
|
Control |
4.782 a |
3.409 a |
0.713 |
8.405 a |
5.157 a |
0.614 |
12.897 a |
7.331 a |
0.568 |
|
|
+2.472 |
+0.451 |
+0.383 |
+0.940 |
+4.421 |
+0.861 |
|||||
|
0.2% (S.S) |
11.303 a |
3.495 a |
0.309 |
8.840 a |
2.429 ab |
0.275 |
11.303 a |
5.839 ab |
0.517 |
|
|
+2.608 |
+0.225 |
+0.383 |
+1.160 |
+1.328 |
+0.743 |
|||||
|
(+136.36) |
(+2.503) |
(+5.171) |
(-52.896) |
(-12.357) |
(-20.351) |
|||||
|
0.4% (S.S) |
15.217 a |
4.092 a |
0.269 |
16.086 a |
3.580 b |
0.223 |
18.255 a |
5.498 b |
0.301 |
|
|
0.000 |
0.000 |
0.000 |
0.000 |
0.000 |
0.000 |
|||||
|
(+218.192) |
(+20.012) |
(+91.378) |
(-30.584) |
(+41.541) |
(-25.007) |
|||||
|
0.6% (S.S) |
16.521 a |
9.974 a |
0.604 |
16.956 a |
3.069 b |
0.181 |
41.300 a |
6.265 b |
0.152 |
|
|
0.000 |
0.000 |
0.000 |
0.000 |
0.000 |
0.000 |
|||||
|
(+245.459) |
(+192.52) |
(+101.72) |
(-40.493) |
(+220.22) |
(-14.545) |
|||||
|
LSD0.05 |
13.541 |
5.917 |
12.726 |
3.535 |
25.671 |
4.895 |
||||
|
Treatments |
STEM |
ROOT |
LEAVES |
|||
|
Ca++ |
Mg++ |
Ca++ |
Mg++ |
Ca++ |
Mg++ |
|
|
--------------------------------------------------Meq/L---------------------------------------------------- |
||||||
|
Control |
3.160 a |
3.289 a |
2.494 a |
3.563 a |
4.904 a |
5.070 a |
|
+0.299 |
+0.474 |
+0.660 |
+0.273 |
+1.910 |
+1.615 |
|
|
0.2% (S.S) |
4.906 a |
1.647 a |
4.075 a |
2.878 ab |
4.490 a |
2.877 a |
|
+2.562 |
+0.819 |
+1.742 |
+0.411 |
+2.759 |
+0.474 |
|
|
(+55.274) |
(-49.912) |
(+63.348) |
(-19.225) |
(-8.435) |
(-43.245) |
|
|
0.4% (S.S) |
1.247 a |
2.467 a |
2.994 a |
3.289 bc |
4.480 a |
3.700 a |
|
0.000 |
0.000 |
0.000 |
0.000 |
0.000 |
0.000 |
|
|
(-60.538) |
(-24.992) |
(+20.016) |
(-7.690) |
(-8.652) |
(-27.026) |
|
|
0.6% (S.S) |
2.495 a |
2.467 a |
1.746 a |
1.644 c |
5.600 a |
4.934 a |
|
0.000 |
0.000 |
0.000 |
0.000 |
0.000 |
0.000 |
|
|
(-21.044) |
(-24.992) |
(-30.011) |
(-53.859) |
(+14.185) |
(-2.689) |
|
|
LSD0.05 |
4.471 |
2.445 |
3.575 |
2.154 |
6.718 |
4.332 |
Table 3: Cation composition of Oscar canola variety grown at different salinity levels
|
Treatments |
STEM |
ROOT |
LEAVES |
||||||
|
Na+ |
K+ |
K+/Na+ |
Na+ |
K+ |
K+/Na+ |
Na+ |
K+ |
K+/Na+ |
|
|
------Meq/L------- |
------Meq/L------ |
-------Meq/L------- |
|||||||
|
Control |
15.651 a |
3.367 ab |
0.202 |
9.420 b |
3.154 a |
0.679 |
15.216 a |
6.393 a |
0.317 |
|
+2.188 |
+0.259 |
+0.881 |
+0.855 |
+1.397 |
+1.312 |
||||
|
0.2% (S.S) |
16.666 a |
2.514 c |
0.248 |
15.218 a |
4.134 a |
0.431 |
18.839 a |
6.564 a |
0.159 |
|
+5.158 |
+0.112 |
+2.896 |
+1.262 |
+1.900 |
+0.839 |
||||
|
(+6.483) |
(-25.324) |
(+61.557) |
(+31.082) |
(+23.807) |
(+2.664) |
||||
|
0.4% (S.S) |
23.471 a |
3.068 bc |
0.102 |
12.753 ab |
2.386 a |
0.434 |
26.375 a |
5.541 a |
0.142 |
|
+5.787 |
+0.266 |
+0.383 |
+0.665 |
+3.899 |
+0.474 |
||||
|
(+49.96) |
(-8.861) |
(+35.382) |
(-24.339) |
(+73.332) |
(-13.336) |
||||
|
0.6% (S.S) |
16.376 a |
4.006 a |
0.104 |
14.057 ab |
1.704 a |
0.391 |
24.202 a |
5.500 a |
0.079 |
|
+2.135 |
+0.225 |
+1.131 |
+0.213 |
+7.986 |
+1.415 |
||||
|
(+4.632) |
(+18.988) |
(+49.229) |
(-45.952) |
(+59.049) |
(-13.967) |
||||
|
LSD0.05 |
13.589 |
0.732 |
5.307 |
2.735 |
14.994 |
3.518 |
|||
|
Treatments |
STEM |
ROOT |
LEAVES |
||||
|
Ca++ |
Mg++ |
Ca++ |
Mg++ |
Ca++ |
Mg++ |
||
|
--------------------------------------------------Meq/L---------------------------------------------------- |
|||||||
|
Control |
4.817 a |
6.440 a |
5.405 a |
3.563 a |
4.487 a |
4.933 a |
|
|
+0.662 |
+1.390 |
+2.297 |
+0.273 |
+0.760 |
+0.949 |
||
|
0.2% (S.S) |
2.990 ab |
3.563 a |
4.239 a |
4.522 a |
4.320 a |
5.756 a |
|
|
+0.745 |
+1.526 |
+1.372 |
+1.443 |
+0.437 |
+0.474 |
||
|
(-37.937) |
(-44.680) |
(-21.576) |
(+26.925) |
(-3.714) |
(+16.668) |
||
|
0.4% (S.S) |
3.737 ab |
3.563 a |
1.746 a |
2.466 a |
4.653 a |
6.304 a |
|
|
+1.127 |
+0.725 |
+0.288 |
+0.237 |
+0.598 |
+0.724 |
||
|
(-22.424) |
(-44.680) |
(-67.701) |
(-30.770) |
(+3.699) |
(+27.775) |
||
|
0.6% (S.S) |
1.912 b |
2.740 a |
2.411 a |
2.055 a |
4.074 a |
4.659 a |
|
|
+0.440 |
+0.494 |
+0.166 |
+0.411 |
+0.958 |
+1.194 |
||
|
(-60.306) |
(-57.447) |
(-55.392) |
(-42.305) |
(-9.204) |
(-5.554) |
||
|
LSD0.05 |
2.557 |
3.658 |
4.397 |
2.518 |
2.334 |
2.861 |
|
Table 4: Cation composition of Ganyou canola variety grown at different salinity levels
|
Treatments |
STEM |
ROOT |
LEAVES |
||||||
|
Na+ |
K+ |
K+/Na+ |
Na+ |
K+ |
K+/Na+ |
Na+ |
K+ |
K+/Na+ |
|
|
-----Meq/L------ |
-----Meq/L----- |
------Meq/L------ |
|||||||
|
Control |
9.709 a |
6.095 a |
0.628 |
10.724 a |
3.665 a |
0.342 |
9.564 a |
3.025 a |
0.316 |
|
+0.631 |
+0.085 |
+1.014 |
+0.523 |
+0.869 |
+0.724 |
||||
|
0.2% (S.S) |
11.883 a |
3.537 b |
0.298 |
11.449 a |
2.386 a |
0.208 |
11.014 a |
3.239 a |
0.294 |
|
+0.766 |
+0.332 |
+0.144 |
+0.614 |
+0.631 |
+0.757 |
||||
|
(+22.38) |
(-41.958) |
(+6.761) |
(-34.885) |
(+15.153) |
(+7.051) |
||||
|
0.4% (S.S) |
12.463 a |
2.599 b |
0.209 |
11.883 a |
3.282 a |
0.276 |
16.665 a |
4.560 a |
0.274 |
|
+0.145 |
+0.592 |
+0.766 |
+0.419 |
+4.277 |
+1.815 |
||||
|
(+28.35) |
(-57.348) |
(+10.811) |
(-10.458) |
(+74.242) |
(+50.733) |
||||
|
0.6% (S.S) |
12.753 a |
2.472 b |
0.194 |
11.593 a |
2.301 a |
0.199 |
12.898 a |
2.855 a |
0.221 |
|
+2.028 |
+0.307 |
+1.780 |
+0.221 |
+0.383 |
+0.378 |
||||
|
(+31.34) |
(-59.442) |
(+8.106) |
(-37.214) |
(+34.850) |
(-5.630) |
||||
|
LSD0.05 |
3.691 |
1.223 |
3.574 |
1.521 |
7.218 |
3.473 |
|||
|
Treatments |
STEM |
ROOT |
LEAVES |
|||
|
Ca++ |
Mg++ |
Ca++ |
Mg++ |
Ca++ |
Mg++ |
|
|
Control |
2.910 a |
3.152 a |
2.494 a |
3.700 a |
2.370 a |
2.740 a |
|
+0.362 |
+0.362 |
+0.381 |
+0.237 |
+0.102 |
+0.494 |
|
|
0.2% (S.S) |
1.995 a |
2.878 a |
2.245 a |
3.288 a |
1.746 ab |
2.740 a |
|
+0.519 |
+0.237 |
+0.288 |
+0.628 |
+0.288 |
+0.494 |
|
|
(-31.436) |
(-8.693) |
(-10.008) |
(-11.117) |
(-26.329) |
0.000 |
|
|
0.4% (S.S) |
2.078 a |
2.192 a |
2.078 a |
2.329 a |
2.161 ab |
2.877 a |
|
+0.440 |
+0.137 |
+0.440 |
+0.362 |
+0.219 |
+1.034 |
|
|
(-28.585) |
(-30.446) |
(-16.676) |
(-37.036) |
(-8.790) |
(+4.990) |
|
|
0.6% (S.S) |
2.328 a |
2.466 a |
4.823 a |
2.466 a |
1.579 b |
2.055 a |
|
+0.083 |
+0.411 |
+2.578 |
+0.474 |
+0.332 |
+0.237 |
|
|
(-20.007) |
(-21.743) |
(+93.346) |
(-33.333) |
(-33.347) |
(-25.006) |
|
|
LSD0.05 |
1.265 |
0.999 |
4.335 |
1.465 |
0.835 |
2.072 |
Table 5: Cation composition of Ganyou-2 canola variety grown at different salinity levels
|
Treatments |
STEM |
ROOT |
LEAVES |
|||||||
|
Na+ |
K+ |
K+/Na+ |
Na+ |
K+ |
K+/Na+ |
Na+ |
K+ |
K+/Na+ |
||
|
------Meq/L------- |
------Meq/L------ |
-------Meq/L------- |
||||||||
|
Control |
7.970 b |
2.855 a |
0.358 |
8.550 a |
2.173 a |
0.254 |
7.970 a |
5.157 a |
0.647 |
|
|
+0.383 |
+0.378 |
+0.145 |
+0.266 |
+0.631 |
+0.558 |
|||||
|
0.2% (S.S) |
9.419 b |
2.216 ab |
0.235 |
8.985 a |
1.918 a |
0.213 |
7.535 a |
4.006 a |
0.532 |
|
|
+0.631 |
+0.225 |
+0.631 |
+0.073 |
+2.318 |
+0.225 |
|||||
|
(+18.179) |
(-22.391) |
(+5.092) |
(-11.762) |
(-5.458) |
(-22.313) |
|||||
|
0.4% (S.S) |
12.753 a |
2.216 ab |
0.174 |
12.608 b |
3.324 a |
0.264 |
13.478 a |
2.727 b |
0.202 |
|
|
+0.289 |
+0.225 |
+0.664 |
+1.534 |
+0.251 |
+0.112 |
|||||
|
(+59.999) |
(-22.391) |
(+47.466) |
(+52.937) |
(+69.095) |
(-36.678) |
|||||
|
0.6% (S.S) |
12.028 a |
2.088 b |
0.174 |
16.231 a |
3.239 a |
0.200 |
13.622 a |
2.301 b |
0.169 |
|
|
+1.288 |
+0.112 |
+0.383 |
+1.619 |
+2.707 |
+0.390 |
|||||
|
(+50.912) |
(-26.862) |
(+89.840) |
(+49.011) |
(+70.910) |
(+66.676) |
|||||
|
LSD0.05 |
2.467 |
0.828 |
1.637 |
3.665 |
5.917 |
1.185 |
||||
|
Treatments |
STEM |
ROOT |
LEAVES |
|||
|
Ca++ |
Mg++ |
Ca++ |
Mg++ |
Ca++ |
Mg++ |
|
|
--------------------------------------------------Meq/L---------------------------------------------------- |
||||||
|
Control |
2.494 a |
2.878 a |
3.077 a |
3.289 a |
2.577 a |
2.603 a |
|
+0.660 |
+0.411 |
+0.220 |
+0.237 |
+0.166 |
+0.597 |
|
|
0.2% (S.S) |
2.162 a |
2.603 a |
4.490 a |
1.781 b |
1.912 ab |
2.055 a |
|
+0.463 |
+0.494 |
+2.759 |
+0.136 |
+0.332 |
+0.411 |
|
|
(-13.335) |
(-9.532) |
(+45.943) |
(-45.850) |
(-25.811) |
(-21.060) |
|
|
0.4% (S.S) |
1.579 a |
2.055 a |
2.162 a |
1.644 b |
1.829 ab |
1.918 a |
|
+0.166 |
+0.411 |
+0.220 |
+0.237 |
+0.362 |
+0.137 |
|
|
(-36.678) |
(-28.573) |
(-29.737) |
(-50.015) |
(-29.031) |
(-26.335) |
|
|
0.6% (S.S) |
4.158 a |
1.918 a |
1.579 a |
2.055 b |
1.413 b |
1.781 a |
|
+2.911 |
+0.137 |
+0.166 |
+0.411 |
+0.166 |
+0.136 |
|
|
(+66.676) |
(-33.356) |
(-48.662) |
(-37.509) |
(-45.170) |
(-31.596) |
|
|
LSD0.05 |
4.932 |
1.264 |
4.536 |
0.893 |
0.889 |
1.224 |
Table 6: Cation composition of Rainbow canola variety grown at different salinity levels
|
Treatments |
STEM |
ROOT |
LEAVES |
|||||||
|
Na+ |
K+ |
K+/Na+ |
Na+ |
K+ |
K+/Na+ |
Na+ |
K+ |
K+/Na+ |
||
|
------Meq/L------- |
------Meq/L------ |
-------Meq/L------- |
||||||||
|
Control |
8.695 a |
4.176 a |
0.480 |
9.275 a |
3.665 a |
0.395 |
6.666 b |
3.367 a |
0.505 |
|
|
+1.397 |
+0.816 |
+1.045 |
+0.225 |
+0.806 |
+0.348 |
|||||
|
0.2% (S.S) |
9.564 a |
3.153 ab |
0.330 |
11.738 a |
2.983 a |
0.254 |
9.419 b |
3.494 a |
0.371 |
|
|
+1.328 |
+0.307 |
+0.904 |
+0.042 |
+0.950 |
+0.085 |
|||||
|
(+10.002) |
(-24.493) |
(+26.562) |
(-18.598) |
(+41.309) |
(+3.792) |
|||||
|
0.4% (S.S) |
11.622 a |
2.813 ab |
0.242 |
13.333 a |
2.130 a |
0.160 |
10.156 b |
3.196 a |
0.315 |
|
|
+0.276 |
+0.127 |
+2.412 |
+0.170 |
+1.372 |
+0.195 |
|||||
|
(+33.671) |
(-32.650) |
(+43.752) |
(-41.870) |
(+52.365) |
(-5.059) |
|||||
|
0.6% (S.S) |
11.159 a |
2.471 b |
0.221 |
14.637 a |
4.305 a |
0.294 |
17.246 a |
2.770 a |
0.161 |
|
|
+0.881 |
+0.085 |
+0.950 |
+2.323 |
+1.780 |
+0.237 |
|||||
|
(+28.338) |
(-40.822) |
(+57.815) |
(+17.452) |
(+158.72) |
(-17.721) |
|||||
|
LSD0.05 |
3.472 |
1.444 |
5.879 |
3.816 |
4.245 |
0.770 |
||||
|
Treatments |
STEM |
ROOT |
LEAVES |
|||
|
Ca++ |
Mg++ |
Ca++ |
Mg++ |
Ca++ |
Mg++ |
|
|
--------------------------------------------------Meq/L---------------------------------------------------- |
||||||
|
Control |
2.328 a |
3.151 a |
2.078 a |
2.466 a |
2.827 a |
3.713 a |
|
+0.545 |
+0.763 |
+0.440 |
+0.628 |
+0.362 |
+0.008 |
|
|
0.2% (S.S) |
1.995 a |
1.918 a |
2.411 a |
2.192 a |
1.995 ab |
2.466 b |
|
+0.519 |
+0.137 |
+0.083 |
+0.494 |
+0.381 |
+0.474 |
|
|
(-14.288) |
(-39.143) |
(+16.020) |
(-11.096) |
(-29.415) |
(-33.573) |
|
|
0.4% (S.S) |
2.328 a |
2.329 a |
2.078 a |
2.055 a |
2.078 ab |
1.507 c |
|
+0.083 |
+0.685 |
+0.440 |
+0.237 |
+0.166 |
+0.137 |
|
|
0.000 |
(-26.480) |
0.000 |
(-16.664) |
(-26.480) |
(-59.417) |
|
|
0.6% (S.S) |
1.413 a |
2.055 a |
1.912 a |
1.507 a |
1.746 b |
2.055 bc |
|
+0.166 |
+0.237 |
+0.166 |
+0.137 |
+0.288 |
+0.237 |
|
|
(-39.298) |
(-34.786) |
(-8.002) |
(-38.897) |
(-38.246) |
(-44.650) |
|
|
LSD0.05 |
1.265 |
1.731 |
1.059 |
1.377 |
1.015 |
0.893 |
Table 7: Cation composition of Abasin_95 canola variety grown at different salinity levels
|
Treatments |
STEM |
ROOT |
LEAVES |
||||||
|
Na+ |
K+ |
K+/Na+ |
Na+ |
K+ |
K+/Na+ |
Na+ |
K+ |
K+/Na+ |
|
|
------Meq/L------- |
------Meq/L------ |
-------Meq/L------- |
|||||||
|
Control |
7.680 a |
3.323 a |
0.433 |
9.419 a |
3.537 a |
0.376 |
11.738 a |
8.482 a |
0.723 |
|
+0.630 |
+0.147 |
+0.950 |
+0.480 |
+1.397 |
+1.753 |
||||
|
0.2% (S.S) |
8.840 ab |
2.983 a |
0.337 |
12.463 a |
2.429 ab |
0.195 |
14.347 a |
4.944 b |
0.345 |
|
+0.144 |
+0.225 |
+1.449 |
+0.195 |
+1.960 |
+0.469 |
||||
|
(+15.094) |
(-10.222) |
(+32.315) |
(-31.323) |
(+22.220) |
(-41.712) |
||||
|
0.4% (S.S) |
9.347 b |
2.045 b |
0.219 |
13.043 a |
2.621 b |
0.201 |
14.782 a |
2.813 b |
0.190 |
|
+0.217 |
+0.511 |
+1.739 |
+0.064 |
+1.739 |
+0.128 |
||||
|
(+21.702) |
(-38.444) |
(+38.466) |
(-25.905) |
(+25.926) |
(-66.836) |
||||
|
0.6% (S.S) |
13.622 a |
2.088 ab |
0.153 |
15.072 a |
1.662 b |
0.110 |
15.651 a |
3.153 b |
0.201 |
|
+1.186 |
+0.112 |
+1.900 |
+0.195 |
+3.620 |
+0.451 |
||||
|
(+77.363) |
(-37.155) |
(+60.006) |
(-53.015) |
(+33.331) |
(-62.819) |
||||
|
LSD0.05 |
5.486 |
1.301 |
8.398 |
1.687 |
10.839 |
3.414 |
|||
|
Treatments |
STEM |
ROOT |
LEAVES |
|||
|
Ca++ |
Mg++ |
Ca++ |
Mg++ |
Ca++ |
Mg++ |
|
|
Control |
2.744 a |
2.603 a |
2.744 a |
3.151 a |
4.740 a |
5.477 a |
|
+0.144 |
+0.763 |
+0.519 |
+0.597 |
+1.008 |
+1.797 |
|
|
0.2% (S.S) |
2.328 a |
2.465 a |
2.162 ab |
3.015 a |
3.492 ab |
4.111 a |
|
+0.649 |
+0.002 |
+0.463 |
+0.274 |
+1.008 |
+1.711 |
|
|
(-15.159) |
(-5.314) |
(-21.219) |
(-4.336) |
(-26.322) |
(-24.941) |
|
|
0.4% (S.S) |
1.995 a |
1.849 a |
1.496 b |
2.672 a |
1.995 b |
2.672 a |
|
+0.249 |
+0.205 |
+0.249 |
+0.205 |
+0.249 |
+0.205 |
|
|
(-27.287) |
(-28.956) |
(-45.469) |
(-15.204) |
(-57.901) |
(-51.205) |
|
|
0.6% (S.S) |
4.490 a |
1.781 a |
1.912 ab |
2.466 a |
2.494 ab |
2.737 a |
|
+2.759 |
+0.136 |
+0.166 |
+0.237 |
+1.008 |
+0.721 |
|
|
(+63.634) |
(-31.588) |
(-30.317) |
(-21.735) |
(-47.377) |
(-50.027) |
|
|
LSD0.05 |
4.759 |
1.626 |
1.442 |
1.856 |
3.056 |
4.462 |
Table 8: Cation composition of Westar canola variety grown at different salinity levels
|
Treatments |
STEM |
ROOT |
LEAVES |
||||||
|
Na+ |
K+ |
K+/Na+ |
Na+ |
K+ |
K+/Na+ |
Na+ |
K+ |
K+/Na+ |
|
|
------Meq/L------- |
------Meq/L------ |
-------Meq/L------- |
|||||||
|
Control |
11.738 b |
2.088 a |
0.178 |
11.014 b |
2.855 a |
0.259 |
11.014 b |
6.265 a |
0.569 |
|
+1.397 |
+0.112 |
+0.881 |
+0.085 |
+0.881 |
+0.255 |
||||
|
0.2% (S.S) |
12.318 b |
1.832 ab |
0.149 |
11.304 b |
2.301 a |
0.204 |
11.304 b |
4.816 b |
0.426 |
|
+0.144 |
+0.153 |
+0.752 |
+0.321 |
+0.752 |
+0.601 |
||||
|
(+4.935) |
(-12.243) |
(+2.633) |
(-19.400) |
(+2.633) |
(-23.131) |
||||
|
0.4% (S.S) |
14.057 ab |
1.747 ab |
0.124 |
14.057 a |
2.088 a |
0.149 |
14.202 a |
3.580 b |
0.252 |
|
+0.383 |
+0.112 |
+0.383 |
+0.112 |
+0.522 |
+0.147 |
||||
|
(+19.755) |
(-16.329) |
(+27.635) |
(-26.871) |
(+28.951) |
(-42.863) |
||||
|
0.6% (S.S) |
15.506 a |
1.491 b |
0.096 |
15.506 a |
2.258 a |
0.146 |
15.941 a |
3.878 b |
0.243 |
|
+0.631 |
+0.259 |
+0.631 |
+0.364 |
+0.806 |
+0.332 |
||||
|
(+32.099) |
(-28.571) |
(+40.791) |
(-20.906) |
(+44.737) |
(-38.102) |
||||
|
LSD0.05 |
2.588 |
0.556 |
2.241 |
0.825 |
2.455 |
1.219 |
|||
|
Treatments |
STEM |
ROOT |
LEAVES |
||||
|
Ca++ |
Mg++ |
Ca++ |
Mg++ |
Ca++ |
Mg++ |
||
|
-----------------------------------------------Meq/L------------------------------------------------------- |
|||||||
|
Control |
2.328 a |
3.837 a |
2.661 a |
3.015 a |
3.160 a |
3.289 a |
|
|
+0.362 |
+0.494 |
+0.220 |
+0.274 |
+0.463 |
+0.411 |
||
|
0.2% (S.S) |
1.746 a |
2.192 b |
1.829 a |
2.192 b |
2.328 ab |
2.192 ab |
|
|
+0.288 |
+0.362 |
+0.582 |
+0.137 |
+0.545 |
+0.362 |
||
|
(-25.011) |
(-42.868) |
(-31.254) |
(-27.286) |
(-26.319) |
(-33.343) |
||
|
0.4% (S.S) |
1.829 a |
2.192 b |
1.333 a |
2.055 b |
2.162 ab |
2.192 ab |
|
|
+0.582 |
+0.137 |
+0.677 |
+0.237 |
+0.506 |
+0.548 |
||
|
(-21.432) |
(-42.868) |
(-49.884) |
(-31.830) |
(-31.582) |
(-33.343) |
||
|
0.6% (S.S) |
1.333 a |
1.781 b |
1.413 a |
2.192 b |
1.333 b |
1.918 b |
|
|
+0.677 |
+0.136 |
+0.166 |
+0.274 |
+0.677 |
+0.137 |
||
|
(-42.723) |
(-53.588) |
(-46.887) |
(-27.275) |
(-57.797) |
(-41.684) |
||
|
LSD0.05 |
1.640 |
1.048 |
1.524 |
0.774 |
1.679 |
1.276 |
|
Means followed by different letters in the same column differ significantly at 95% probability level according to New Duncan’s Multiple Range Test; Figures in parentheses indicate % promotion (+) and reduction (-) over control; S.S=Sea Salt
The parameter of K/Na ratio being important in determining salt tolerance of a plant has been calculated and presented in Table 1, 2, 3, 4, 5, 6, 7 and 8. Due to the decrease in K+ content with increasing salinity, the K/Na ratio showed decreased values in stem, root and leaves under higher salinity levels as compare to their respective control in all varieties. The maintenance of higher K/Na ratios of K+ versus Na+ selectivity in tissues subjected to salt stress is considered one of the important physiological mechanisms contributing to salt tolerance of many plant species (Greenway and Munns, 1980; Wyn Jones et al., 1984; Ashraf, 1994). The K/Na ratio for nonhalophytes should generally be more than 1 for normal functioning of all metabolic processes in the plant. The K/Na ratio in all the varieties of Canola was less than 1 in the leaves under different salinity level. K+ concentration in plants generally decreases with increase of salinity levels in plant cells (Cramer, 1997). This may be due to inability of plants to control sodium uptake due to presence of excessive sodium under salinity and inhibitory effects on metabolic energy related part of duel uptake mechanism proposed for potassium uptake by Epstein (1972).
Acknowledgement
The authors are thankful to the Department of Botany, Abdul Wali Khan University Mardan for providing full support, encouragements and necessary facilities for conducting this research.
Conflict of Interest
There is no conflict of interest among the authors.
Authors’ Contribution
Rafiq Ahmed and Muhammad Hamayun designed the experiment. Humaira Gul wrote the manuscript and supervised the laboratory work performed by Aqib Sayyed and Shabeena. Data was analyzed by Husna.
References