South Asian Journal of Life Sciences
Research Article

Temporal Variation of Birds Population in Aguégués (Benin)
Donald S. Sossou1,2*, Hilaire K. Yaokokore Beibro1, Pierre K. Kouadio1, Saint Guillaume K. Odoukpé1, Mickael E. Konan1, Emile D. Fiogbé2
1University of Cocody-Abidjan, UFR Biosciences, Laboratory of Zoology and Animal Biology, BP 582 Abidjan 22, Ivory Coast; 2University of Abomey-Calavi, Faculty of Science and Technology (FAST), Department of Zoology, Laboratory for Research on Wetlands. 01 BP.526 Cotonou (Benin).
Abstract | Few studies were based on the temporal variation in birds of South-East Benin. In order to study the temporal variation of birds population in Aguégués, some ornithological survey were carried out monthly from August 2017 to July 2018 by the method of punctual abundance indexes enabled the counting of 14191 individuals gathered into 268 species, 55 families and 18 orders. In Aguégués, the highest mean specific richness and birds’ abundance were observed respectively in BDS with 45 ± 22.37 species and 561 ± 240.81 individuals though the lowest values were recorded in BRS with respectively 23 ± 12.5 species and 324 ± 355.43 individuals. The picks of mean specific richness and abundance reached in BDS corresponded to the period of migratory birds coming to the South-East Benin wetland. A high positive correlation and highly significant to the 5% threshold (cor = 0.87; t = 15.178; df = 11; p-value = 1.007e-08) were noticed between the monthly fluctuation of mean number and the mean specific richness by the student test for pair series. The highest mean indexes of Shannon-Weaver (2.99±0.60) and the Pielou mean equitability (0.88±0.04) were recorded respectively in BDS and BRS. The lowest respectively 2.40±0.58 and 0.77±0.09 were calculated in BRS and SRS. The mixed linear model generalized showed the monthly variations of ecological indexes among stations are significant to the 5% threshold except plantations, Lake Nokoué and Porto-Novo lagoon. Besides, monthly variations are not due to the random effect of months (R² marginal < R² conditional).
Keywords: Aguégués, Benin, Birds, Population, Variation
Editor | Muhammad Nauman Zahid, Quality Operations Laboratory, University of Veterinary and Animal Sciences, Lahore, Pakistan.
Received | February 09, 2019 Accepted | February 22, 2019; Published | March 10, 2019
*Correspondence | Donald S Sossou, University of Cocody-Abidjan, UFR Biosciences, Laboratory of Zoology and Animal Biology, BP 582 Abidjan 22, Ivory Coast; Email: sossoudonald@gmail.com
Citation | Sossou DS, Beibro HKY, Kouadio PK, Odoukpe SGK, Konan ME, Fiogbe ED (2019). Temporal variation of birds population in aguégués (benin). S. Asian J. Life Sci. 7(1): 8-13.
DOI | http://dx.doi.org/10.17582/journal.sajls/2019/7.1.8.13
ISSN | 2311–0589
Copyright © 2019 Sossou et al. This is an open access article distributed under the Creative Commons Attribution License, which permits unrestricted use, distribution, and reproduction in any medium, provided the original work is properly cited.
INTRODUCTION
Aguégués is a zone subject to seasonal floods that affect the biodiversity (Djenontin and Guidibi, 2006). As remarkable biodiversity component, birds are excellent “health” bio-indicator of ecosystems (Louette and al., 1995; Bennun and Fanshawe, 1997); (Pedel and Fabri, 2012) due to their sensitivity to environment changes and their mode of territory occupation by providing information on the quality of many media (Yaokokoré-Béibro, 2010; Lougbegnon and Libois, 2011).
According to (Blondel, 1975), the knowledge of birds includes the study of composition and structure of population and the progression of this structure according to time and space. In the South-East of Benin, few studies were based on the temporal variation of birds. The existing concerns mainly the spatio-temporal distribution of water birds in the down valley of Ouémé (Adjakpa et al., 2016).
The current study aims to improve the knowledge status of birds in Benin generally and to know particularly the favorable periods of bird species in Aguégués for their preservation.
MATERIALS AND METHODS
Study Area
Situated between 6°30’ North latitude and 2°30’ East longitude, Aguégués common (Figure 1) is a body of islet located in the down part of Ouémé River submerged by floods three to five times yearly (Djenontin and Guidibi, 2006). It is characterized by tropical humid climate made of two rainy seasons from April to July (BRS) and October to November (SRS) and two dry seasons from December to March (BDS) and August to September (SDS). The relief is characterized by flooded plains. Soils were hydromorphe with clay favorable to agriculture (Djenontin and Guidibi, 2006). The delta of Ouémé is the main water plan of Aguégués (Figure 1). The vegetation was essentially made of graminaceae (Cyperus alopecuroides, Cyperus articulatus, Cyperus dilatatus, Andropogon gayanus, Aniseia martinicensis) with some forest islets made of trees (Raphia hookeri, Mitragyna stipulosa, Ficus asperifolia, Alstonia congensis, Paullinia pinnata, Anthocleista vogelii…) palm trees (Elaeis guineense), acacias (Acacia auriculiformis), and mangrove (Rhizophora racemosa, Avicennia germinans). The fauna is made of migratory birds (Chlidonias niger, Himantopus himantopus, Charadrius dubius, Charadrius hiaticula, Gallinago gallinago), ophidian reptiles (Psammophis elegans, Dipsadoboa viridis, Bitis arietans, Naja sp., Dromophis lineatus…), buffalo (Tragelaphus scriptus), palmiped birds (Dendrocygna viduata, Nettapus auritus, Phalacrocorax africanus) and all categories of fishes. The main activities applied by the population are agriculture, trading, breeding and fishery (Djenontin and Guidibi, 2006).
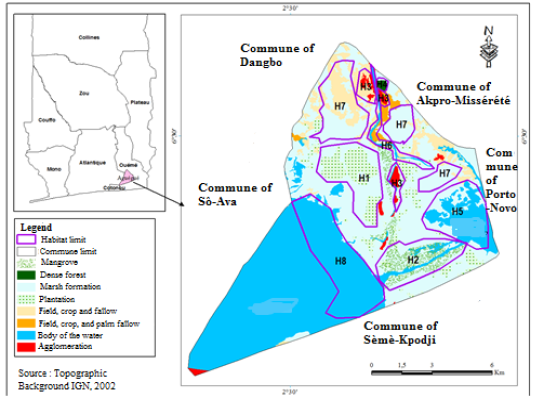
H1: Plantation, H2: Mangrove, H3: House, H4: Forest, H5: Porto-Novo lagoon, H6: Ouémé River, H7: Prairie and H8: Lake Nokoué.
Material
The material was made of binoculars (Brushnell 150142 jumelles 10 x 42 h2o) for birds observation; a photograph device (Nikon Coolpix P900), a Dictaphone (Sony ICD-PX720) for recording non identified birds species shouting; the discographic collection of (Chappuis, 2000) relative to West African birds shouting serving to identify specimens recorded by Dictaphone; a GPS (Garmin Drive 51 SE LMT-S) for geo-location of sampling stations through habitats and the West African birds identification book (Borrow and Demey, 2015). A motor pirogue served to transport on the water plan.
Methods
The study was carried out from August 2017 to July 2018 by the (Blondel, 1970) counting method of punctual abundance indexes (PAI). This method enabled a global valuation of birds on many stations (Oekle, 1981; Delahaye, 2006). Listening points were 500 meters equidistant in open media (Lake Nokoué, Porto-Novo lagoon, Ouémé River, flooded prairies, mangrove and houses) and 200 meters in forest and plantations were installed in relation to practicability of the different habitats. Birds’ counting was carried out twice a month from 6:30 to 10:30 am and 3:30 to 6:30 pm corresponding to birds’ intensive activities periods (Bibby and al., 1992; Yaokokore-Beibro, 2001). The nomenclature adopted is those of (Borrow and Demey, 2015).
The study of temporal variation of bird population was based on parameters such as specific richness ( ) that is often considered as the first indicator to qualify the taxonomic biodiversity of communities (Legendre and Legendre, 1998), the abundance of species (
 , where ni is the number of individual of the species i in a given habitat), the Shannon-Weaver diversity index (
 , where N is the total number of individual of the whole species (Hutcheson, 1970; Ramade, 1994) and the Pielou equitability (
 ), with
  in the stations. Mean abundance (Abm), mean specific richness (RSm), mean Shannon-Weaver diversity index (H’m) and mean Pielou equitability (Jm) calculated from those obtained (Ab, RS, H’ and J) in stations per month were used to analyze the temporal variation of population in Aguégués.
The (Thiollay, 1986) normal considering the relative observation frequency ( where N = Σ ni) was used to identify dominant species during months with high abundance in each station. Thus, a species is dominant (D) if Fr ≥ 5 %.
Statistical Analysis
The significance of the variation in these diversity parameters according habitats (fixe factor) and months (random factor) was tested by using a linear mixed model nlme (Pinheiro et al., 2017) and lmer Test with the software R 3.2.5 (R Core Team, 2016). Besides, the student test for pair series was carried out to test correlation among mean monthly abundance and mean monthly specific richness. Statistical results were appreciated to 5% threshold.
RESULTS
Specific Richness and Abundance
Figure 2a revealed the mean specific richness fluctuated between 23 ± 12.5 species during the Big Rainy Season (BRS) and 45 ± 22.37 species during the Big Dry Season (BDS). Interpretation of Figure 2d showed the monthly specific richness varied among stations. Thus, in the Ouémé River and forest, it increased respectively in the BDS (January) with 24 species (12.18%) and 73 species (11.92%) and a decrease with 06 species (3.04%) and 32 species (5.23%) during the BRS (June). Respectively in Porto-Novo lagoon and mangrove, the specific richness increased during the BDS (January) with 26 species (13.06%) and 73 species (12.58%). In contrary, it decreased progressively in these habitats respectively during the BRS (July) with 09 species (4.52%) and 28 species (4.52%). In houses and plantations, the specific richness increased respectively during the BDS (November) with 32 species (11.22%) and 39 species (10%) and a decrease during the BRS (June) with 17 species (5.96%) and 23 species (5.89%). In Lake Nokoué and the prairie, it increased respectively during the BDS (June) with 06 species (2.77%) and 52 species (6.25%).
The monthly variation of specific richness among stations is significant. At 5% threshold, the Ouémé River specific richness (16±4.75) was significantly lower than those in forest (51±10.83), mangrove (48±12.72), plantations (33±3.67) and prairies (69±7.04). In contrary, it’s insignificantly lower than those in Lake Nokoué (18±5.50) and Porto-Novo lagoon (17±3.25). The variation in specific richness among stations was not due to months random effect (R² marginal < R² conditional) (Table 1). Birds mean number varied between 324±355 individuals (ind) (during the BRS and 561±241.5 ind during the BDS (Figure 2a). Figure 2c revealed the monthly relative birds abundance varied according to station. Indeed, in Ouémé River, Porto-Novo lagoon and mangroves, birds relative abundance increased during the BDS (January) respectively with 354 ind (0.85 %), 458 ind (1.11 %) and 714 ind (1.73 %). In contrary, birds’ relative abundance decreased drastically during the BRS especially in July in Ouémé River, Porto-Novo lagoon and mangroves respectively with 23 ind (0.06 %), 31 ind (0.08 %) and 180 ind (0.44 %). In the forest and Lake Nokoué, birds’ relative abundance increased during the BDS (February) respectively with 426 ind (1.03%) and 521 ind (1.26%). But these numbers decreased progressively in July (BRS) respectively with 105 ind (0.25%) and 293 ind (0.71%). In plantations and prairies, birds’ relative abundance increased during the BDS (March) respectively with 181 ind (0.44%) and 1597 ind (3.88%). In contrary, it deceased respectively in plantations and prairies in April during the BRS with 126 ind (0.31%) and 911 ind (2.21%).
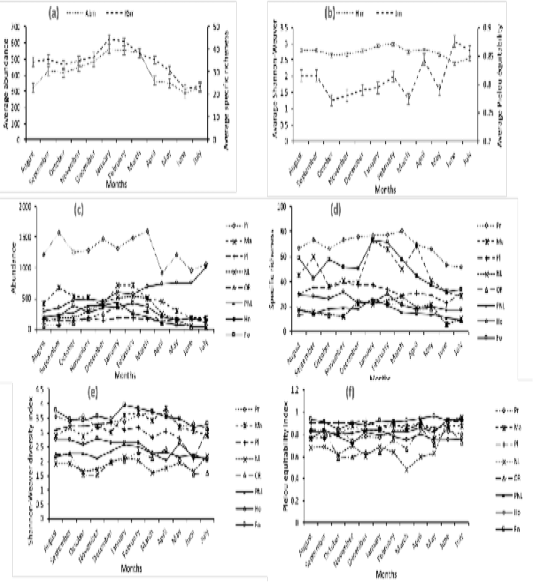
Pr: prairie, Ma: mangrove, Pl: plantations, LN: Nokoué Lake, OR: Ouémé River, PNL: Porto-Novo lagoon, Ho: houses and Fo: forest.
The use of (Thiollay, 1986) normal during months of high birds’ number per habitat enabled the identification of dominant species. Thus, species with high number were Dendrocygna viduata (52.78%) in Lake Nokoué; Dendrocygna viduata (31.07%), Nettapus auritus (35.31%), Chlidonias niger (5.93%), Phalacrocorax africanus (7.71%), Ardeola ralloides (19.85%), Bubulcus ibis (20.32%), Ardea purpurea (8.17%), Dendrocygna viduata (5.84%), Actophilornis africana (7.71%) in Porto-Novo lagoon; Dendrocygna viduata (31.07%), Nettapus auritus (35.31%), Chlidonias niger (5.93%) in Ouémé River; Bubulcus ibis (10.87%), Streptopelia semitorquata (6.58%), Streptopelia senegalensis (7.78%), Apus affinis (6.58%), Hirundo abyssinica (7.08%), Hirundo smithii (27.94%), Hirundo rustica (5.38%), Malimbus scutatus (19.66%) in houses; Muscicapa caerulescens (8.68%), Ploceus nigricollis (12.20%), Estrilda caerulescens (3.28%) in forest; Ploceus cucullatus (17.4%), Euplectes afer (5.07%), Lagonosticta senegala (5.07%) in prairie; Dendrocygna viduata (10.50%), Streptopelia semitorquata (8.26%), Ploceus nigerrimus (8.26%), Ploceus aurantius (8.40%) in mangrove, Dicrurus adsimilis (6.07%), Passer griseus (11.04%), Pachyphantes superciliosus (5.52%), Euplectes macroura (8.28%), Pyrenestes ostrinus (6.07%), Uraeginthus bengalus (7.18%) in plantations.
The monthly variation of the abundance among stations is significant. At 5% threshold, the monthly birds’ number in Ouémé River (152±97.87) was significantly lower (P < 0.05) than those in forest (266±92.33), houses (598±158.75), Lake Nokoué (267±156), Porto-Novo lagoon (215±111.33), mangrove (462±145.08), prairie (1277±179.80) and insignificantly lower than those in plantations (156±15) (Table 1). Besides, the marginal R² was lower than the conditional R². This reveals the significant variation of birds’ monthly number in stations was not due to the random effect of month. It’s important to notice the monthly rhythms of abundance and specific richness in stations were similar to those obtained in the entire Aguégués (Figure 2a). The monthly fluctuation of the mean abundance and specific richness in birds’ population were similar. We noticed a high correlation significant to the 5% threshold between these two diversity parameters (cor = 0.87; t = 15.178; df = 11; p-value = 1.007e-08).
Shannon-Weaver Diversity Index and Pielou Equitability
The mean Shannon-Weaver diversity index of birds’ population in Aguégués was higher during the BDS (Figure 2b) and particularly in February (2.99±0.60). But it was low in BRS especially in June (2.40±0.58). Figure 2e revealed the monthly Shannon-Weaver diversity index varied according to stations. Indeed, in Ouémé River and mangrove, the Shannon-Weaver diversity index increased in April, BRS respectively with 2.44 and 3.84. But it decreased progressively in October, SRS with 1.53 (Ouémé River) and 2.85 (mangrove). The Shannon-Weaver diversity index was higher during the BDS in forest with 3.96 in January, in plantations with 3.34 in December and in prairies with 3.58 in October though it was low during the BRS especially with 3.18 in June (forest), 2.3 in April (house), 2.02 in July (Porto-Novo lagoon), 2.09 in June (plantations) and 3.14 in July (prairies). The monthly variation of Shannon-Weaver diversity index among stations was significant. Thus, in Ouémé River (1.97±0.28), this index was significantly lower than those in forest (3.55±0.18), houses (2.50±0.24), Porto-Novo lagoon (2.28±0.11), mangrove (3.23±0.27), plantations (3.03±0.22) and prairies (3.42±0.17) at 5% threshold though they were insignificantly higher than those in Lake Nokoué (1.87±0.16). This significant variation of Shannon-Weaver diversity index among stations wasn’t due to month random effect (R² marginal < R² conditional) (Table 1).
Besides, the Pielou equitability (Figure 2b) was higher during the BRS in June (8.8±0.04) and low during the SRS mainly in October (0.77±0.07). In habitats such as Ouémé River, forest, Lake Nokoué and prairie, the monthly Pielou equitability was higher during the BRS respectively with 0.86 (June); 0.96 (May); 0.95 (June) and 0.90 (April). The low values in Ouémé River, forest, Lake Nokoué and prairie were obtained during the BDS respectively with 0.60 (November); 0.88 (December); 0.48 (March) and 0.74 (November). The highest monthly Pielou equitability was recorded during the BDS especially in December and January with 0.84 and the lowest during the BRS mainly in April, May and June with 0.75 in houses. We noticed in plantations the highest Pielou equitability was recorded during the BDS (December) and during the BRS (June) with 0.92. The lowest Pielou equitability was obtained during the BRS with 0.83 in May in plantations. In mangrove and Porto-Novo lagoon, the highest Pielou equitability was calculated during the BRS respectively with 0.90 in April and 0.93 in June. The Small Dry Season (SDS) corresponded to the period of low Pielou equitability in mangrove and Porto-Novo lagoon with 0.76 in August (Figure 2f). The monthly variation of Pielou equitability among stations was significant. The Pielou equitability in Ouémé River (0.73±0.09) was significantly lower than those in forest (0.91±0.02), houses (0.79±0.03), Porto-Novo lagoon (0.82±0.04), mangrove (0.84±0.04), plantations (0.88±0.02) and prairies (0.80±0.04) and insignificantly higher than those in Lake Nokoué (0.68±0.09). The variation of Pielou equitability among stations was not due to month random effect (R² marginal < R² conditional) (Table 1).
DISCUSSION
The monthly picks of the mean abundance and specific richness were reached in January corresponding to the Big Dry Season (BDS). etIt was stated from November, Palearctic migratory birds’ species left their nest to winter in the West African wetlands (Dodman and Diagana, 2003). This corroborates with the presence of migratory and dominant species recorded during the monthly picks. Besides, Aguégués are flooded each year from August to November by Ouémé River (Djenontin and Guidibi, 2006). The period from December to February corresponding to the fall provided food availability to birds in Aguégués. This trend justified the picks of birds’ number, the specifc richness observed and the high diversity with individuals distributed in the population in February, characterized by a pick of Shannon-Weaver index. During the fall, there were many ponds and swamps in the plains that constitute feeding area to birds (Dodman and Diagana, 2003). Our results confirmed January as month of abundant number of birds (Dodman and al., 1999; Dodman and Diagana,
Table 1: Results synthesis of the mixed effect linear model
| Abundance | Richeness | H’ | J | |||||||||||||||||||||
| Coef (se) | Z | Prob | Coef (se) | z | Prob | Coef (se) | t | Prob | Coef (se) | t | Prob | |||||||||||||
| Intercept (Ouémé River) | 4.99 (0.07) | 75.43 | <0.001 | 2.78 | 31.34 | <0.001 | 14.25 (2.75) | 5.18 | <0.001 | 14.42 (1.84) | 7.82 | <0.001 | ||||||||||||
| (0.09) | ||||||||||||||||||||||||
| Site : Forest | 0.56 (0.03) | 19.09 | <0.001 | 1.13 (0.08) | 13.85 | <0.001 | 53.83 (3.35) | 16.05 | <0.001 | 17.92 (2.42) | 7.41 | <0.001 | ||||||||||||
| Site : House | 1.37 (0.03) | 52.30 | <0.001 | 0.37 (0.09) | 3.99 | <0.05 | 17.08 (3.35) | 5.09 | <0.001 | 5.92 (2.42) | 2.45 | <0.001 | ||||||||||||
| Site : Nokoué Lake | 0.57 (0.03) | 19.25 | <0.001 | 0.09 (0.10) | 0.94 | >0.05 | -4.42 (3.35) | -1.32 | >0.05 | -3.17 (2.42) | -1.31 | >0.05 | ||||||||||||
| Site : Porto-Novo Lagoon | 0.35 (0.03) | 11.41 | <0.001 | 0.01 (0.10) | 0.10 | >0.05 | 10.42 (3.35) | 3.11 | <0.001 | 8.92 (2.42) | 3.68 | <0.05 | ||||||||||||
| Site : Mangrove | 1.11 (0.03) | 41.20 | <0.001 | 1.08 (0.08) | 13.10 | <0.001 | 41.67 (3.35) | 12.42 | <0.001 | 10.92 (2.42) | 4.52 | <0.001 | ||||||||||||
| Site : Plantations | 0.03 (0.03) | 0.90 | >0.05 | 0.68 (0.09) | 7.82 | <0.001 | 34.17 (3.35) | 10.19 | <0.001 | 15.50 (2.42) | 6.41 | <0.001 | ||||||||||||
| Site : Prairie | 2.13 (0.02) | 85.93 | <0.001 | 1.43 (0.08) | 18.18 | <0.001 | 48.92 (3.35) | 14.59 | <0.001 | 7.50 (2.42) | 3.10 | <0.001 | ||||||||||||
| Variance of the random effect of the month | 0.05 | 0.03 | 23.33 | 5.64 | ||||||||||||||||||||
| Residual variance | - | - | 67.48 | 35.08 | ||||||||||||||||||||
| R² marginal (%) | 0.63 | 0.81 | 0.83 | 0.53 | ||||||||||||||||||||
| R² conditional (%) | 0.78 | 0.90 | 0.87 | 0.59 |
| |||||||||||||||||||
2003; Diagana and Dodman, 2006). The high mean Pielou equitability recorded during the BRS (June) showed individuals were equal-distributed in the population in this period characterized by the absence of migratory because their presence was followed by dominance in the zone. The equitability tends to 01 when there is no dominance in the population (Hill, 1973). The strongest rains in June also contributed to the high equitability. According to (Bouchon and al., 2004) the equitability tends to increase with the reduction of dominant species abundance in proportion as population degradation.
The lowest birds’ number and their specific richness observed during the big rainy season (April to July) could be due to strong rains making difficult birds’ feeding. The same reasons explain the period of picks and low values of diversity parameters obtained in stations that coincided with those of Aguégués. The monthly significant variations of diversity indexes among stations showed generally that each station constitute a distinct habitat. The high positive and significant correlation between the monthly specific richness and birds’ monthly number showed that birds’ number and species number progressed similarly in relation to time.
CONCLUSION
The study of temporal variation of birds’ population in Aguégués enabled to know that the period of high abundance, specific richness and diversity is situated in the big dry season and correspond to the coming of migratory birds in the South-East wetland of Benin. But, individuals are most equal-distributed in the population during the big rainy season especially in June corresponding to the period of low birds’ activity. It’s important to study the impacts of environmental and entropic factors in the monthly fluctuation of the different birds’ diversity parameters in this common.
ACKNOWLEDGEMENTS
Authors give a thank to the Worlwide Bank through the African Center of Excellence on Climate Change, Biodiversity and Sustainable Agriculture (ACE-CCBSA) for its financial support granted to SOSSOU S. Donald.
AUTHORS’ CONTRIBUTION
All authors contributed equally in this study and writing of the manuscript.
REFERENCES