Journal of Infection and Molecular Biology
Research Article
J. Inf. Mol. Biol. 4 (1): 1 - 8
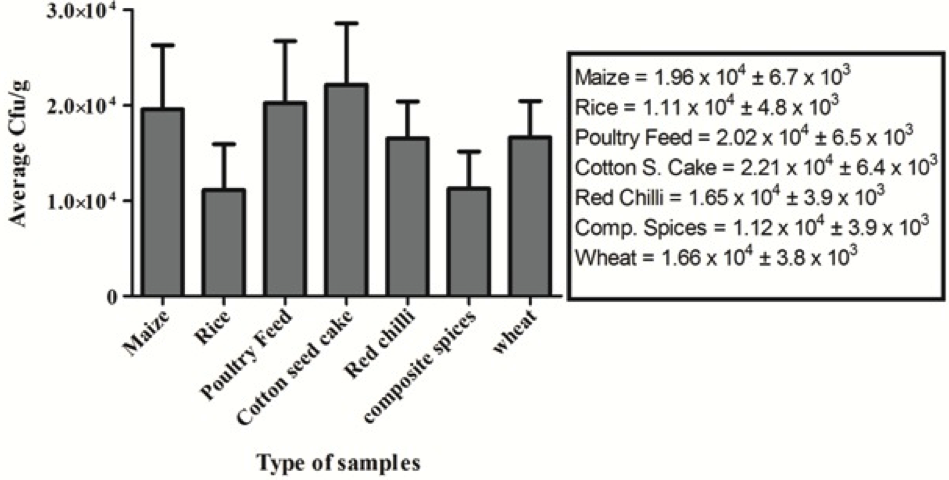
Figure 1
Average total yeast and mould count of different food commodities; Triplicate analyses were made for all measurements. Indicated values are means (n = 3) ± SD
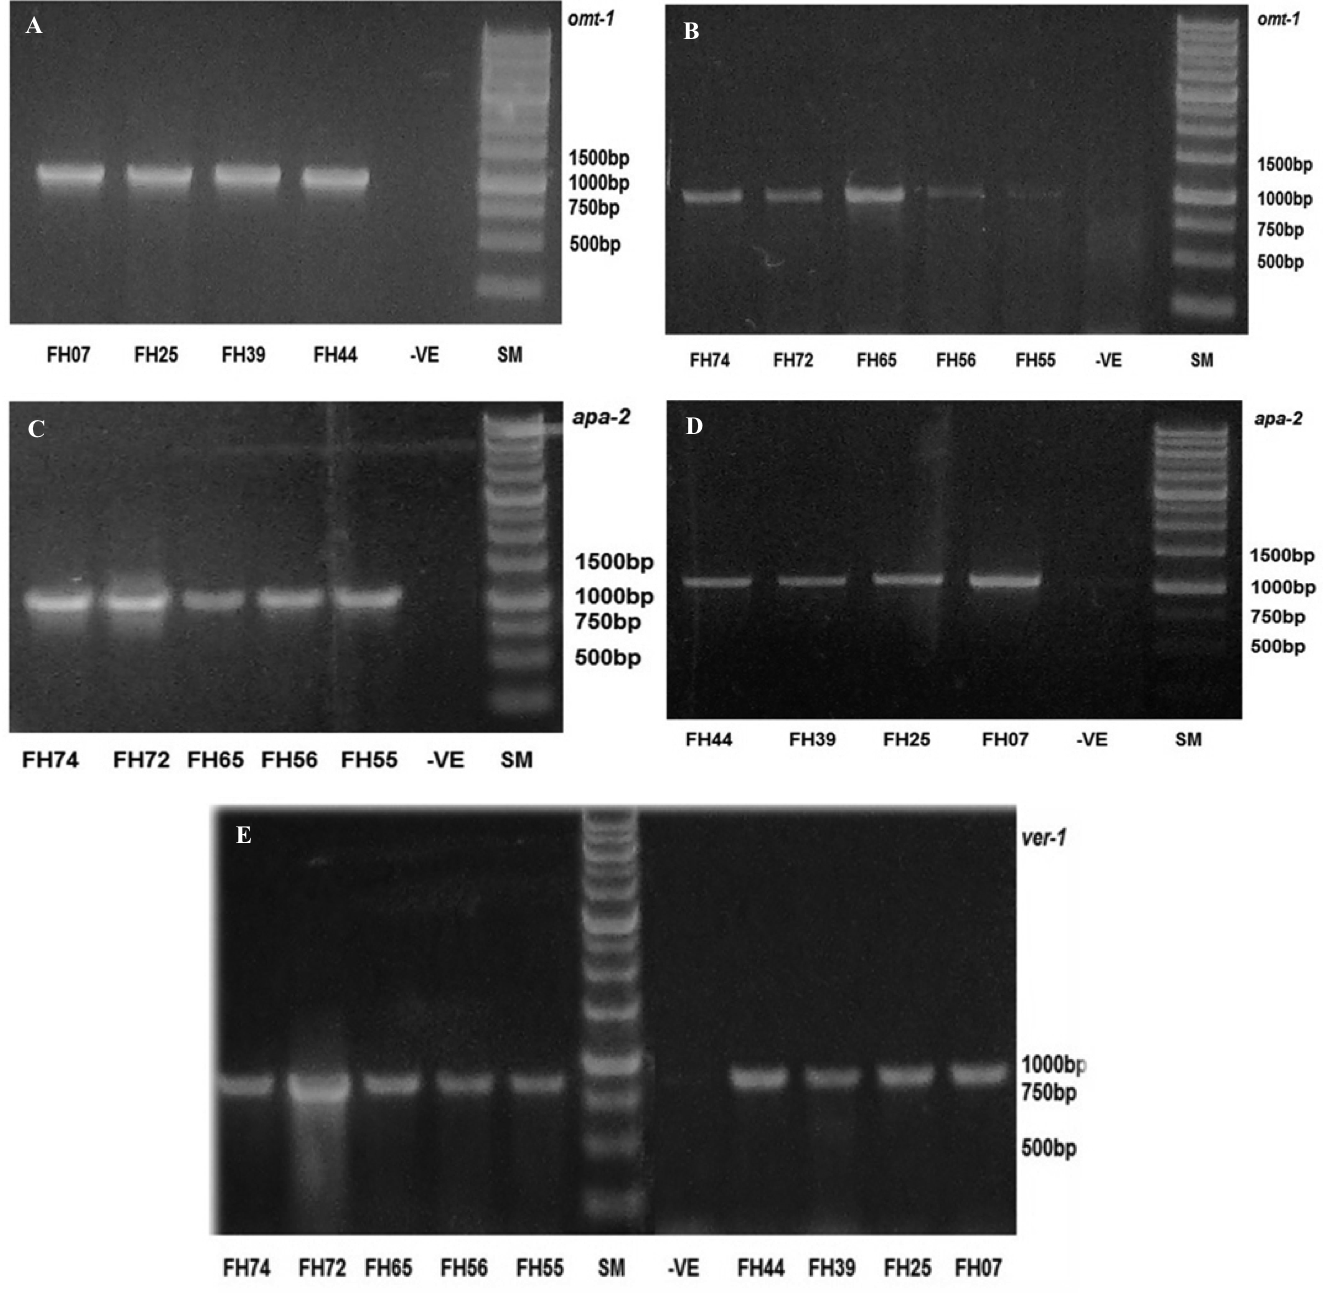
Figure 2
Gel electrophoresis examination showing specific bands of: (A & B) omt-1gene (Amplified 1,024bp); (C & D) apa-2 gene (Amplified 1,032bp); (E) ver-1 gene (Amplified 895bp) FH07: A. flavus; FH25: A. flavu; FH39: A. flavus; FH44: A. parasiticus; FH74: A. flavus; FH72: A. flavu; FH65: A. parasiticus; FH56: A.parasiticus; FH55: A. flavus; SM: 1kb DNA size marker; -ve control containing master mix without samples

Retention factor


