Journal of Infection and Molecular Biology
Short Communication
Journal of Infection and Molecular Biology 1 (1): 17 – 19Study of Genetical Genomics; a Preliminary Study
Muhammad Muddassir Ali1*, Furqan Awan2, Hassaan Bin Aslam3, SulimanQadirAfridi3
- Institute of Biochemistry and Biotechnology, University of Veterinary and Animal Sciences, Lahore 54600, Pakistan
- Department of epidemiology and public health, University of Veterinary and Animal Sciences, Lahore 54600
- Department of Microbiology, University of Veterinary and Animal Sciences, Lahore 54600, Pakistan
*Corresponding author:muddassir.ali@uvas.edu.pk
ARTICLE CITATION:
Ali MM, Awan F, Aslam HB, Afridi SQ (2013). Study of genetical genomics–a preliminary study.J. Inf. Mol.Biol. 1 (1): 17 – 19.
Received: 2013–03–04, Revised: 2013–03–10, Accepted: 2013–03–12
The electronic version of this article is the complete one and can be found online at
(
http://nexusacademicpublishers.com/table_contents_detail/2/27/html
)
which permits unrestricted use, distribution, and reproduction in any medium, provided the original work is properly cited
ABSTRACT
Calculating gene clusters by various clustering approaches is usual way to study gene expression data. In recent, in vitro experiments are being conducted to use widespread applications of genetical genomics approaches in non–model and model species. Nowadays, many bioinformatics tools are under trails to make the correlation based networks to explore the genetic pathways.2000differentially expressed genes of cultured and uncultured bone cells from rabbit were taken. Network analysis was carried out from two Bioinformatics tools, BioLayout and GeneNet. David database was used to conduct functional analysis for differentially expressed genes. There were no significant overlapping functional categories between the cultured and uncultured dataset. Different genes participating in bone growth were identified. It is suggested that by using different network tools, area of genetical genomics could be explored.
Microarray expression data derive thousands of differentially expressed transcripts from just from very small sample size. Different factors may be involved like changes in the interests of biological system and technical artifacts to affect this sample and data obtained. General approaches which are utilized to analyze the microarray data are to derive clusters by many explorative clustering techniques or by statistically significant variations between the groups of samples to analyze the microarray data. Correlation based networks are mode to analyze the gene expression data and to see co expression in expression profiles of data. This idea have already been used by many authors and researchers (Frankeet al., 2006; Zhang and Horvath, 2005) by previously establishes statistical approaches like Pearson’s correlation coefficient. Nowadays in–vitro studies are used to establish and study the genetical genomics in broad ranges. In genetical genomics, gene expression and marker genotype studies are done in a segregating population (Jansen, 2003; Rockman and Kruglyak, 2006). Genetic pathways are studied in gentical genomics. Genetic Pathways are made in graphical forms in which individual genes (nodes) interact and make functional linkages with other genes (graph edges). Many tools of bioinformatics are used to make these genetic pathways in form of graphical conventions. But every tool has its own limitations in giving complete biological inference because of built in computational algorithms. Nowadays different in vivo and in vitro studies are made in combinatio in wide range to see the similarity in results (Haley and Koning, 2007).
A comparison can be conducted on gene expression datasets by using network based tools GeneNet and BioLayout. In this study, cultured and uncultured osteocytes to be compared are taken from the rabbit.Aim of the study was to make the comparison between cultured and uncultured data to find out the similarities by using the data–driven, network–based approaches. So, BioLayout and GeneNet was used to make correlation based networks and after getting the results from these tools, DAVID analysis was done to make the comparison of gene annotation results of cultured versus fresh samples to find similarities and differences in the results.
The softwares GeneNet (Schäferet al., 2006) and BioLayout (Freeman et al., 2007) were used to make correlation based regulatory networks for the 2000 most significantly differentially expressed genes of cultured and uncultured bone cells of rabbit were used. GeneNet is an R package and uses the graphical Gaussian models (GGMs) while BioLayout makes the clusters by Pearson correlation coefficient. The correlation threshold 0.85 was taken to obtain the maximum number of clusters. Markov clustering algorithm (MCL) was run which is an inbuilt algorithm in this software and derive the cluster nodes by computing probability simulation. Then clusters and network was viewed by using the cluster viewer feature. Overlapping transcripts IDs among all clusters taken and subjected to the DAVID database for gene set enrichment analysis. Gene ontology tool was used to do the analysis in DAVID.
The same analysis was also conducted by using same dataset in GeneNet. Before running the GeneNet, installation of corpcor, locfdr, longitudinal and fdrtool was done (Efron, 2004). Then the generated network topology text file from GeneNet was obtained and loaded into Cytoscape (Killcoyneet al., 2009) for making visualization of generated clusters and networks from GeneNet. Similarly DAVID analysis was conducted for the generated clusters in the same way as it was done in BioLayout. To get the significant annotations only P–values less than 0.05 was taken and finally a comparison was made between the significant annotations of the BioLayout and GeneNet results.
When general comparison was conducted between cultured and uncultured datasets by using Microsoft Excel (2007), only 230 genes found to be overlapping among 2000 genes. DAVID analysis revealed following functional categories, negative regulation of cell cycle, antral ovarian follicle growth, regulation of organelle organization. Negative regulation of nuclear division, regulation of transcription,DNA–dependent, response to hormone stimuli and endoplasmic reticulum.
By conducting BioLayout analysis a total of 738 nodes, 7625 edges and 38 clusters were obtained for the interaction dataset containing the gene IDS for both cultured and uncultured datasets. Graphs were also generated in BioLayout that were showing the gene expression pattern in clusters. In the graphs, the genes which were more expressed had a peak whereas low expressed genes had a downward pattern in the graphs. Network was showing nodes and edges and clusters were representing the co–expressed genes in list form (Figure 1).
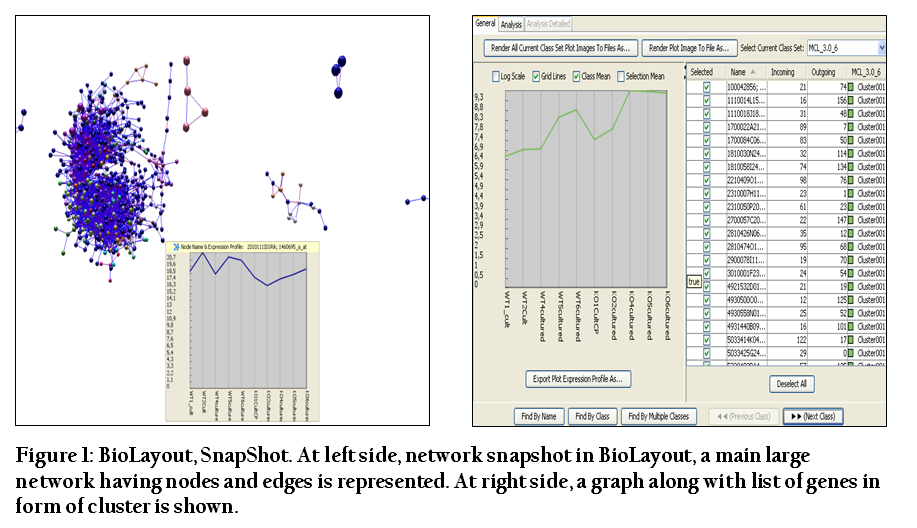
Figure 1: BioLayout, SnapShot. At left side, network snapshot in BioLayout, a main large network having nodes and edges is represented. At right side, a graph along with list of genes in form of cluster is shown
GeneNet generated 148 nodes and 150 edges. The network file was loaded in to Cytoscape for making visualization and this generated information in form of network and cluster. In Cytoscape a big network was observed. The genes which were having the functional interactions with each other were in one network.
Only two terms, “cytoplasm and cytoskeleton”, were overlapped in all categories having a P–value less than 0.05 for the interaction dataset. The P–values for cytoskeleton and cytoplasm were 0.0047 and 0.035 in BioLayout, whereas in Gene Net they were 0.027 and 0.025, respectively. Similarly, it was also observed that there were different genes involved in same processes of both tools as it was observed in comparison of fresh and cultured dataset in BioLayout (Table 1&2).
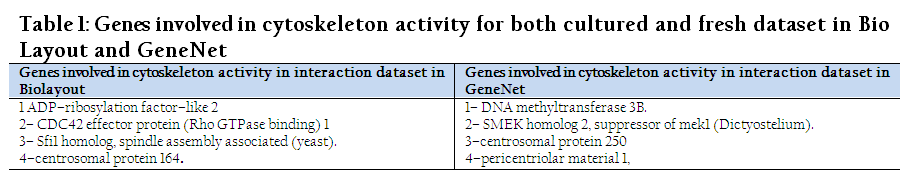
Table 1: Genes involved in cytoskeleton activity for both cultured and fresh dataset in Bio Layout and GeneNet
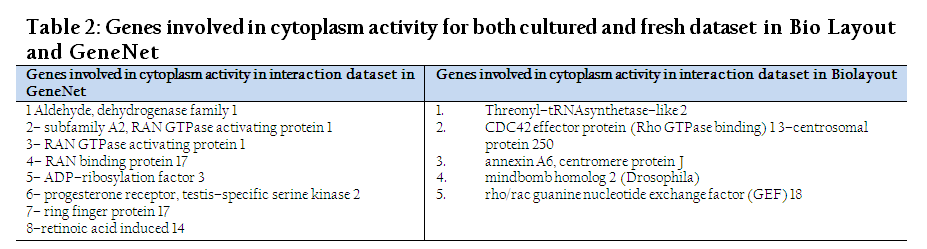
Table 2: Genes involved in cytoplasm activity for both cultured and fresh dataset in Bio Layout and GeneNet
BioLayout have the ability to make the large graphs along with hundreds of edges and nodes by using the pairwise Pearson correlation coefficients and by sophisticated layout algorithm. GeneNet, on the other hand, calculates the nodes and edges by partial correlation matrices and uses the Benjamini and Hochberg's approach (Benjamini and Hochberg's, 1995).
In GeneNet a very low number of edges and nodes are observed due the use of partial correlation measures because it calculates the linear correlation between two genes by removing the effect of any distinct correlation effect of any other genes. A higher number of edges and nodes are obtained in BioLayout due to the use of Pearson correlation which calculates the correlations among genes by even directing the indirect correlations of all other genes.
From the results it was obvious that general comparison of the cultured and uncultured data from the DAVID database without using the network approach revealed that there were significant functional categories like regulation of organelle organization, regulation of cell cycle, regulation of transcription, response to hormone stimulus etc. From previous literature it is clear that SOCS2 have a major role in many pathways like regulation of growh hormones (Turnely, 2005), activation of transcription 5b target in liver (Vidal et al., 2007) and regulation of organization in the growing skeleton (Macraeet al., 2009) and in growth regulation (Greenhalghand, 2005) which supports our findings.
CONCLUSION
Our findings showed that there were no significant common and overlapping functional categories when comparing the cultured and uncultured datasets. Different genes participating in bone growth were identified. Based on these findings it is suggested that useful biological information can be explored for studying genetical genomics by using different network tools. Still, more verifications and repetitions are needed to confirm these findings by using different combination of bioinformatics tools.
REFERENCES
Benjamini and Hochberg Y (1995).Controlling the false discovery rate: a practical and powerful approach to multiple testing. J. R. Statist. Soc. B. 57: 289–300
Efron B (2004). Large-scale simultaneous hypothesis testing: the choice of a null hypothesis. J. Am. Statist.Assoc. 99: 96–104.
http://dx.doi.org/10.1198/016214504000000089
Franke L, Van Bakel H, Fokkens L, De Jong ED, Egmont-Peterson M, and Wijmenga C (2006). Reconstruction of a functional human gene network, with an application for prioritizing positional candidate genes.Am. J. Hum Genet. 78: 1011 – 1025.
http://dx.doi.org/10.1086/504300
PMid:16685651 PMCid:PMC1474084
Freeman TC, Goldovsky L, Brosch M, Van Dongen S, Mazière P, Grocock RJ, Freilich S, Thornton J, and Enright AJ (2007). Construction, visualisation and clustering of transcription networks from microarray expression data. PLoS Comput Biol.3(10): 206.
http://dx.doi.org/10.1371/journal.pcbi.0030206
PMid:17967053 PMCid:PMC2041979
Greenhalgh CJ, Rico-Bautista E, Lorentzon M, Thaus AL, Morgan PO, Willson TA, Zervoudakis P, Metcalf D, Street I, Nicola NA, Nash AD, Fabri LJ, Norstedt G, Ohlsson C, Flores-Morales A, Alexander WS and Haley CS, de Koning DJ and Cabrera CP (2007).Genetical Genomics: Combining Gene Expression with Marker Genotypes in Poultry. Poult Sci. 86: 1501–1509.
http://dx.doi.org/10.1093/ps/86.7.1501
Jansen RC (2003). Studying complex biological systems using multifactorial perturbation. Nat. Rev. Genet. 4: 145–15.
http://dx.doi.org/10.1038/nrg996
PMid:12560811
Killcoyne SGW, Carter JS, and Boyle J (2009).Cytoscape: a community based framework for network modeling. Methods Mol. Biol. 563: 219-239.
http://dx.doi.org/10.1007/978-1-60761-175-2_12
PMid:19597788
Macrae VE, Horvat S, Pells SC, Dale H, Collinson RS, Pitsillides AA, Ahmed SF and Farquharson C (2009).Increased bone mass, altered trabecular architecture and modified growth plate organization in the growing skeleton of SOCS2 deficient mice.J Cell Physiol. 18: 276-84.
http://dx.doi.org/10.1002/jcp.21593
PMid:18803233
Rockman MV and Kruglyak L (2006).Genetics of global gene expression. Nat. Rev. Genet. 7: 862–872.
http://dx.doi.org/10.1038/nrg1964
PMid:17047685
Schäfer J, Rainer O and Strimmer K (2006). Reverse Engineering Genetic Networks using the GeneNet Package. R News. 6: 50-53.
Turnley AM (2005). Role of SOCS2 in growth hormone actions.Trends EndocrinolMetab.16: 53-8.
http://dx.doi.org/10.1016/j.tem.2005.01.006
PMid:15734145
Vidal OM, Merino R, Rico-Bautista E, Fernandez-Perez L, Chia DJ, Woelfle J, Ono M, Lenhard B, Norstedt G, Rotwein P and Flores-Morales A (2007).In vivo transcript profiling and phylogenetic analysis identifies suppressor of cytokine signaling 2 as a direct signal transducer and activator of transcription 5b target in liver.MolEndocrinol. 21: 293-311.
http://dx.doi.org/10.1210/me.2006-0096
PMid:17008382
Zhang B and Horvath S (2005).A general framework for weighted gene co-expression network analysis. Stat. Appl. Genet. Mol. Biol. 4: 17
http://dx.doi.org/10.2202/1544-6115.1128
PMid:16646834


