Research Journal for Veterinary Practitioners
Research Article

Effect of AB070597 on Blood-Serum Creatinine Concentration in Cats with Chronic Kidney Disease
James D. Archer
Applied Research Laboratory, Veterinary Studies Project, 25104 Broadwell Avenue, Harbor City, California 90710, USA.
Abstract | The objectives of this study were to examine whether AB070597, a dietary supplement of amino acids and a peptide, had an effect on progressive increases in blood-serum creatinine concentration (SCr) and disease advancement in cats with chronic kidney disease (CKD). Fifty-nine privately owned cats with confirmed CKD were enrolled in this study. Twenty-seven cats were given AB070597 orally twice daily, and 32 remaining cats served as non-treated controls. Cats participated in the study for 24-104 weeks. Cats received standard care, including subcutaneous fluids, antibiotics, and anti-hypertensive therapy, as directed by their veterinarians, with the exception that dietary protein was not restricted. Blood-serum creatinine concentrations were measured at the beginning of the trial and at 12-week intervals. Body weight was measured at study beginning and at varying times during the study. The stage of the renal disease at the onset of the trial was scored using the criteria set out by the International Renal Interest Society (IRIS). Bi-daily oral administration of AB070597 significantly reduced median SCr for the overall study period (P=0.0084) and at all-time points (P≤0.0269), except week 84 (P=0.0747). Mean disease stage was reduced in the treatment group when compared to the control group (P=0.0184) at the end of the study. Treated cats were 19.8 times more likely to have a lower disease stage at the end of the study compared to untreated cats. Body weight increased in 59%, was unchanged in 15%, and decreased in 26% of treated cats whereas body weight increased in 6%, was unchanged in 10%, and decreased in 84% of untreated cats. Together, these findings suggest that AB070597 may be a useful tool for stabilizing SCr in some cats with CKD and that the formulation warrants further study.
Keywords | AB070597, cats, chronic kidney disease, dietary supplement, renal insufficiency
Editor | Muhammad Abubakar, National Veterinary Laboratories, Islamabad, Pakistan.
Received | June 12, 2015; Revised | July 23, 2015; Accepted | July 25, 2015; Published | August 03, 2015
*Correspondence | James D Archer, Applied Research Laboratory, Veterinary Studies Project, 25104 Broadwell Avenue, Harbor City, California 90710, USA; Email: photoresearch@sbcglobal.net
Citation | Archer JD (2015). Effect of AB070597 on blood-serum creatinine concentration in cats with chronic kidney disease. Res. J. Vet. Pract. 3(3): 58-68.
DOI | http://dx.doi.org/10.14737/journal.rjvp/2015/3.3.58.68
ISSN | 2308-2798
Copyright © 2015 Archer. This is an open access article distributed under the Creative Commons Attribution License, which permits unrestricted use, distribution, and reproduction in any medium, provided the original work is properly cited.
Introduction
Chronic renal disease is a common clinical finding in geriatric cats. Prevalence increases with age, with roughly 5% of cats 7-10 years old, 10% of cats 10-15 years old and 30% of cats older than 15 years affected (Polzin et al., 1992). In a previous study, the mean age of cats diagnosed with CKD was 12.8±4.4 years (Boyd et al., 2008). The International Renal Interest Society (IRIS) developed a staging system for CKD in cats and dogs for the purpose of facilitating communication about diagnosis and management of CKD. Serum creatinine (SCr) concentration is used for IRIS staging, since this test of kidney function is readily available in veterinary practices (IRIS Staging of CKD, 2013). Most cats with CKD will progress through Stages 2 (SCr=1.6-2.8 mg/dL), 3 (SCr=2.9-5.0 mg/dL) and 4 (SCr>5.0 mg/dL; end-stage disease) over time (Boyd et al., 2008; Elliott and Barber, 1998; Syme et al., 2006). Disease progression in some cats is a non-linear process, with periods of stability followed by abrupt increases in SCr, while other cats show an approximately linear increase in SCr over time (Brown, 1996; Elliot et al., 2003). Chakrabarti et al. (2012) also demonstrated that some cats progress slowly over years, while others advance rapidly to end-stage disease within months.
Goldstein et al. (1999) determined that cats with naturally occurring CKD have abnormal serum amino acid profiles. Concentrations of several nonessential amino acids, including citrulline, are elevated, and concentrations of several essential amino acids, including arginine, are decreased. When cats were grouped by appetite or severity of disease, significant alterations in plasma amino acid levels were observed. The amount of dietary protein had no significant effect on plasma amino acid concentrations, and because of that, the authors surmised that short-term protein-restricted diets would have no detrimental effect on plasma amino acid concentrations. Humans with CKD also display abnormal serum amino acid profiles, including increased citrulline concentrations and reduced arginine concentrations, which correlate with decreased creatinine clearance rate (Ceballos et al., 1990; Kumar et al., 1998). A reduced creatinine clearance rate usually manifests as elevated SCr. The kidney is considered a major site for arginine synthesis, with the rate-limiting step being the delivery and uptake of citrulline to the renal cortex. However, exogenous delivery of citrulline to animals with CKD does not result in increased arginine production because of reduced synthase and lyase activity in the renal cortex (Chen and Baylis, 2010).
Previous studies in humans with CKD have shown that dietary supplementation with specific amino acids or keto-acids plus amino acids can arrest time-related escalation of SCr in some patients (Yatzidis, 2004; Mitch et al., 1984). The glomerular filtration rate (GFR) in human increases with L-arginine supplementation (Smoyer et al., 1991). Reyes et al. (1994) convincingly established that dietary supplementation with L-arginine slows the progression of renal disease in rats with advancing disease, and Dumont et al. (2001) demonstrated that SCr excretion was augmented in uremic rats supplemented with 0.1% L-arginine in their diets. Morris and Rogers (1978) reported that normal adult cats developed ammonia intoxication when fed an arginine-free diet but not when the diet consisted of at least 0.4% arginine. Therefore, L-arginine becomes essential in normal animals under certain conditions, with the corollary that L-arginine supplementation may benefit animals under those same conditions.
Plasma concentrations of several amino acids are abnormal in cats and humans with CKD. Plasma levels of L-arginine, glycine, and glutamate are significantly decreased in cats with CKD, compared to non-CKD cats (Goldstein et al., 1999). Renal L-arginine is significantly reduced in human CKD patients (Tizianello et al., 1980) and plasma L-glutamine levels are decreased in established renal failure in humans (Cobo et al., 2007). Additionally, plasma L-histidine levels are significantly lower in humans with CKD, compared to their normal counterparts (Wantanabe et al., 2008), and plasma asparagine levels decrease progressively in human CKD patients with inflammation, malnutrition or both (Suliman et al., 2005). Intracellular levels of L-carnosine are also decreased in human patients with uremia (Bergström et al., 1978).
Based on the author’s review of the literature, the hypothesis is that supplementation with certain amino acids might increase GFR, decrease SCr, and improve renal function in cats with CKD. This initial study evaluated changes in SCr to determine if oral supplementation with AB070597, a dietary supplement containing amino acids and a peptide, can reduce the increase in SCr over time or slow disease progression in cats with CKD.
Materials and Methods
Cats
Thirty-seven privately owned domestic cats were screened for enrollment into the treatment group of this study. Ten were excluded, based on diagnoses of acute azotemia (which resolved with treatment; n=4), pre-renal, post-renal, and other causes of kidney failure, including hyperthyroidism (n=2), polycystic kidney disease (n=1), pyelonephritis (n=1), renal lymphoma (n=1), and dry-form pathogenic feline coronavirus (n=1). The remaining 27 cats ranged in age from 5-17 years (median=13 years). The cats were domestic shorthair (n=24), domestic long hair (n=2), and Maine Coon (n=1). Owners provided informed consent before enrolment. Cats remained under the care of their owners and the medical supervision of their veterinarians throughout the study. All cats had been fed commercially available non-prescription, non-protein-restricted diets before beginning the study. Low protein diets have been often-times prescribed to treat symptoms of uraemia and to minimize ongoing renal damage in mammals with CKD caused by the by-products of protein metabolism. Nevertheless, all cats were maintained on their original diets throughout the study, since protein restriction would have unavoidably lowered oral amino acid intake values from baseline values at the beginning. Cats that met the following inclusion criteria were eligible for enrolment: 1) SCr ≥2.3 mg/dL, 2) urine specific gravity ≤1.035, and 3) either elevated blood urea nitrogen (BUN) (near or above 30 mg/dL) or a history of clinical signs consistent with CKD (e.g., chronic polyuria or polydipsia, or small kidneys on abdominal palpation, or a blood serum phosphate level that was near or above the high end of the normal reference range [7.0 mg/dL]). Cats were categorized into IRIS stages based on SCr at the time of enrolment. A retrospective control arm of the study enrolled non-treated cats (n=32) that met the same inclusion criteria as the treatment arm animals. These cats ranged from 2-19 years (median=14.5 years) of age at enrolment, and included domestic shorthair (n=25), domestic medium hair (n=1), domestic long hair (n=1), Maine Coon (n=1), Tonkinese (n=1), Persian (n=2) and Chartreux (n=1) breed cats.
AB070597
The amino acids and peptide for the formulation of AB070597 were purchased from Spectrum Chemical Company (Gardena, California, USA) and Alfa Aesar (Ward Hill, Massachusetts, USA), respectively. Each 300 mg dose of AB070597 included 25 mg L-arginine, 50 mg glycine, 50 mg L-glutamine, 25 mg L-histidine, 50 mg L-aspartic acid, 50 mg L-glutamic acid, and 50 mg L-carnosine. Cats assigned to AB070597 were dosed twice daily. Each dose was mixed with 1.5 mL of water and was administered directly into the subject’s mouth, or sprinkled directly onto a small amount of food that was fed to the subject.
Body Weight
Body weight was recorded at study entrance and periodically throughout the study.
Blood Sample Collection
At each hospital visit, a blood sample (2.0-3.0 mL) was collected from the jugular or saphenous vein and placed into serum separator tubes. Whole blood samples were allowed to clot at room temperature and were then centrifuged. The separated serum was removed by transfer pipette and was dispensed into labelled transport tubes. The samples were sent to local veterinary diagnostic reference laboratories (Antech Diagnostics, Headquarters, Irvine, California, USA; Idexx Laboratories, Headquarters, Westbrook, Maine, USA; or LABtechnik, s.r.o., Kamenice 771/34, Brno 62500, Czech Republic).
Urine Sample Collection
Urine was collected by cystocentesis or by the free catch method. Samples were refrigerated and placed in ice-packed containers prior to shipment to the same reference laboratories used for blood-sample analysis where they were allowed to normalize to room temperature before analysis.
Laboratory Measurements
Blood-serum concentrations of SCr, blood urea nitrogen and phosphate were measured every 12 weeks, up to 104 weeks, or death, whichever occurred first. SCr measurements were performed at Idexx, Antech, or LABtechnik diagnostic laboratories using an Olympus AU2700 Chemistry Analyzer, an Olympus AU5431 Chemistry Analyzer, (Olympus America, Center Valley, PA, United States) or an Analyzator Cormay Accent-200 (LABtechnik; PZ Cormay S.A., Lublin, Poland), respectively. Urine specific gravity (USG) was measured every 12 weeks, up to 104 weeks, or death, whichever occurred first. The USG measurements were made with a Clinitek Atlas Automated Urine Chemistry Analyzer (Siemens AG, Erlangen, Germany) (CAAUCA). Measurements were made no greater than 24 hours after sample collection.
The SCr coefficient of variation (CV), as determined by Idexx Laboratories, was 3.33%, 1.88% (low end, high end); The SCr CV, as determined by Antech Diagnostics was less than 3% for within-run samples with a total precision of less than 6%; and averaged 5.53% for LABtechnik. The CV for USG using CAAUCA was <3.0%.
Statistical Analysis
Blood-serum creatinine data were analysed using rank analysis of covariance (ANCOVA). Each observation of SCr was replaced with its rank among the entire dataset. Ties were decided by taking the mean rank. Using these ranked data, a traditional ANCOVA model was fit. The final model included the covariates time, treatment arm, rank value of baseline measurement, and the interaction between treatment arm and time. The rank value of baseline was included as a covariate based on visual inspection of the median values over time because baseline SCr measurements between the treatment and control groups were not the same and could impact the interpretation of treatment effect.
IRIS disease stage data were analyzed by converting SCr measurements to disease stages: stage 1 (SCr<1.6 mg/dL), stage 2 (SCr, 1.6-2.8 mg/dL), stage 3 (SCr, 2.9-5.0 mg/dL), and stage 4 (SCr>5.0 mg/dL). A generalized estimating equation (GEE) was fit to the data using PROC GENMOD. The model included the covariates treatment arm, time, stage of disease at baseline, and the interaction between treatment arm and time. A multinomial distribution for disease stages with a cumulative logit link function was assumed. The working correlation matrix was set as independent based on the multinomial distribution. A van Elteren test was also conducted to assess differences between the treatment groups for disease stage at the end of the study stratified by baseline stage of disease. Disease stages were additionally modelled using rank analysis of covariance (ANCOVA) as described for SCr. The resulting model included the covariates time, treatment arm, rank value of baseline disease stage, and the interaction between the treatment arm and time. All analyses were conducted using SAS 9.2, Cary, NC and at significance level 0.05.
Results
Treatment Group Time-in-Study and IRIS Distribution
The data are presented as medians (ranges). Twenty-seven cats, 13 (5-17) years old and weighing 4.0 (2.2-7.2) kg were enrolled. Treated cats remained on study for 96 (24-104) weeks, distributed as follows: (13 cats-104 weeks, 1 cat-96 weeks, 2 cats-60 weeks, 2 cats-48 weeks, 5 cats-36 weeks, and 4 cats-24 weeks). Ten cats were in IRIS stage 2, while 12 others were in stage 3, and 5 were in stage 4 at enrolment. The time-in-study for stage 2, 3, and 4 cats was 104 (36-104), 54 (24-104), and 24 (24-104) weeks, respectively. Five treated cats (18%) with IRIS stage ≥3 died during the course of the study.
Table 1: Parameter estimates for analysis of SCra rank measurements
|
Parameter/Comparison (t=time) |
Estimate |
Standard Error |
CI |
P-value |
|
Control |
16.12 |
1.69 |
12.615, 19.628 |
<0.0001 |
|
Treatment |
8.318 |
2.08 |
4.013, 12.623 |
0.0006 |
|
Overall Difference |
7.804 |
2.693 |
2.218, 13.389 |
0.0084* |
|
Difference (t=12 Weeks) |
6.679 |
2.930 |
0.809, 12.549 |
0.0265* |
|
Difference (t=24 Weeks) |
10.963 |
3.436 |
4.078, 17.849 |
0.0023* |
|
Difference (t=36 Weeks) |
9.207 |
3.479 |
2.209, 16.205 |
0.0110* |
|
Difference (t=48 Weeks) |
8.472 |
3.693 |
1.019, 15.926 |
0.0269* |
|
Difference (t=60 Weeks) |
8.005 |
3.384 |
1.147, 14.861 |
0.0233* |
|
Difference (t=72 Weeks) |
7.538 |
3.098 |
1.235, 13.842 |
0.0206* |
|
Difference (t=84 Weeks) |
6.210 |
3.371 |
-0.657, 13.077 |
0.0747 |
|
Difference (t=96 Weeks) |
7.631 |
3.047 |
1.380, 13.883 |
0.0186* |
|
Difference (t=104 Weeks) |
7.804 |
2.693 |
2.218, 13.389 |
0.0084* |
a SCr=serum creatinine; * Values marked with superscript are significant (P≤0.05)
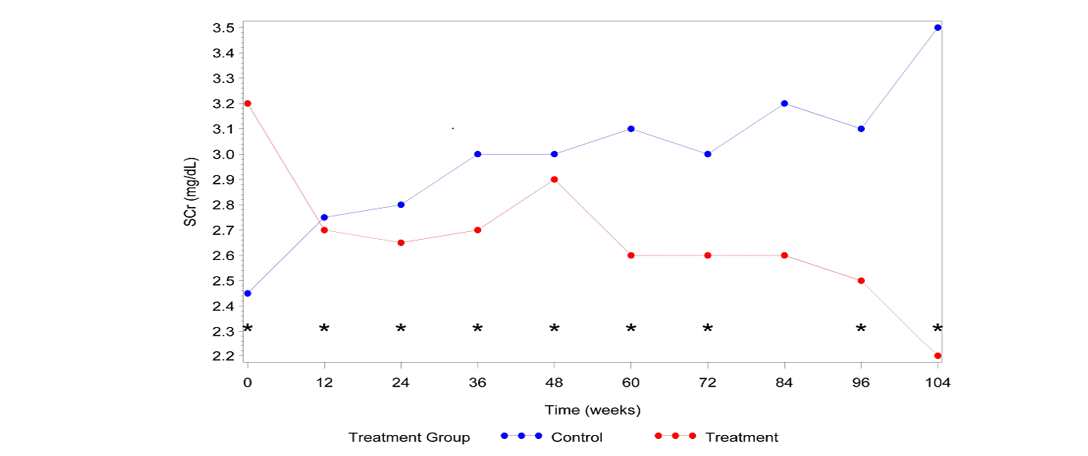
Figure 1: Median SCra vs. Time
a SCr=serum creatinine; * Significant difference between groups (P≤0.05)
Table 2: IRISa disease stage GEEb model fixed effects and significance
|
Fixed Effect |
Chi-Square Test Statistic |
P-Value |
|
Treatment Arm |
11.88 |
0.0006* |
|
Time |
13.31 |
0.1493 |
|
Baseline Stage of Disease |
15.97 |
<0.0001* |
|
Treatment Arm Time |
18.21 |
0.0328* |
aInternational Renal Interest Society; bGeneralized estimating equation; *Values marked with superscript are significant (P≤0.05)
Control Group Time-in-Study and IRIS Distribution
Thirty-two cats, 14.5 (2-19) years old and weighing 4.7 (2.3-8.4) kg acted as controls. Control cats remained on study for 96 (24-104) weeks, distributed as follows: (15 cats-104 weeks, 4 cats-96 weeks, 3 cats-84 weeks, 1 cat-72 weeks, 2 cats-60 weeks, 3 cats-48 weeks, 1 cat-36 weeks, and 3 cats-24 weeks). Twenty-three cats were in IRIS stage 2, while 7 others were in stage 3 and 2 were in stage 4 at enrolment. The time-in-study for stage 2, 3 and 4 cats was 104 (24-104), 84 (24-104), and 64 (24-104) weeks, respectively. Twelve control cats (38%) died during the course of the study.
Effect of AB070597 on SCr
Cats that received AB070597 as an oral supplement had significantly lower SCr measurements over the observation period than did cats in the control group (P=0.0084). This difference was significant at all-time points except at time 84 Weeks (P=0.0747). The median SCr values are plotted over time in Figure 1. The median rank values are plotted over time in Figure 2. Table 1 quantifies the difference in rank scores between the treatment groups and the overall mean rank for the treatment and control groups.
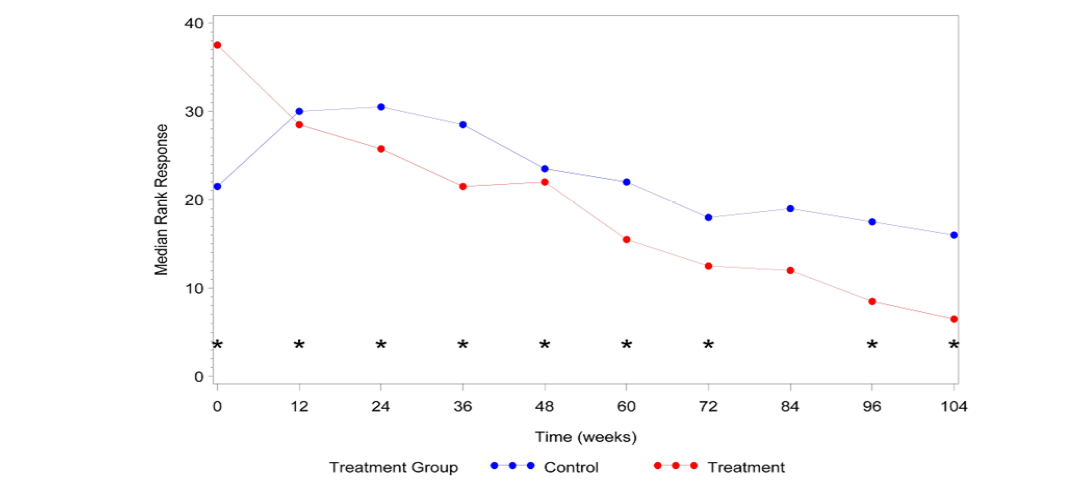
Figure 2:Median SCra rank vs. Time
aSCr=serum creatinine; *Significant difference between groups (P≤0.05)
aInternational Renal Interest Society; *Significant difference between groups (P≤0.05)
Effect of AB070597 on IRIS Disease Stage
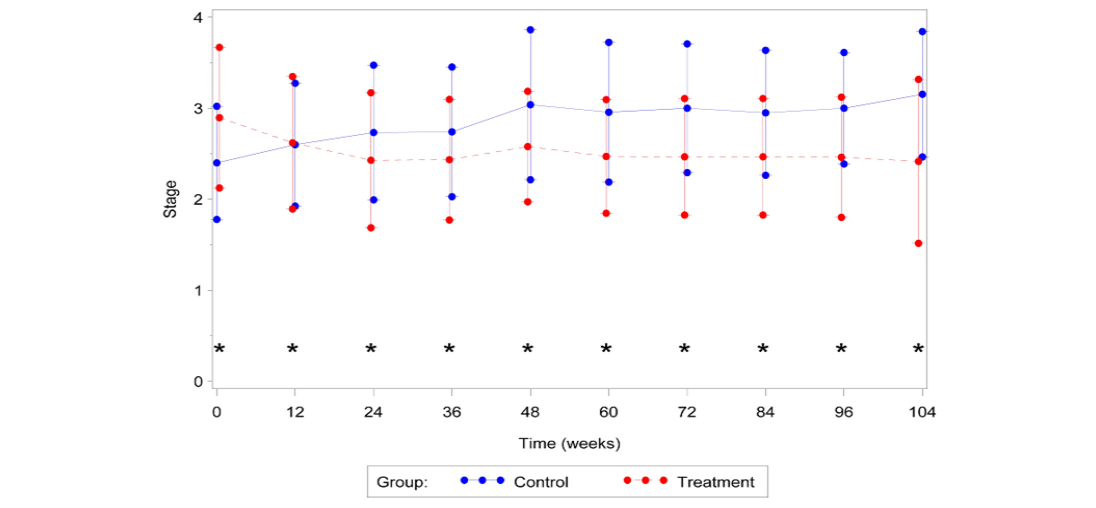
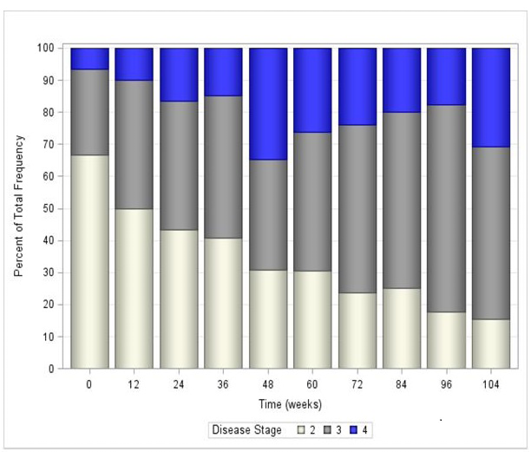
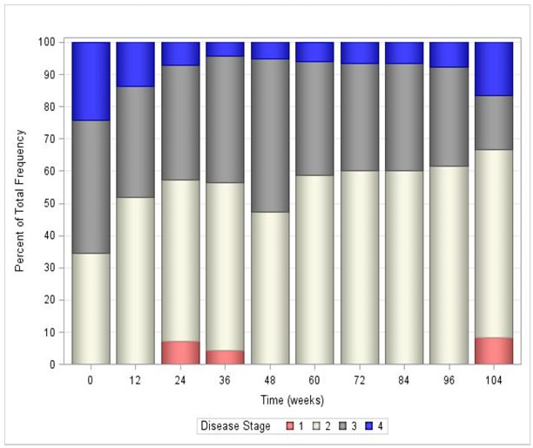
All fixed effects in the GEE model were deemed significant other than the covariate time (Table 2). However, the interaction between time and treatment was significant (P=0.0328), which required keeping the main effect of time in the final statistical model. Overall, the estimated odds that disease stage was lower at the end of the study compared to the beginning was 19.8 times higher for a cat in the treatment group, compared to a cat in the control group. Table 3 reports the odds ratios and their significance for each time point in the study overall. In general, treatment with AB070597 increased the odds of a reduction in disease stage. This can be seen graphically in Figure 3, which shows the mean stage of disease at each time point by treatment group, and in tabular form in Table 4. Figures 4 and 5 further show the frequency of each disease stage across time split between control and treatment groups. These figures show that higher proportions of animals in the control group have higher IRIS disease stage scores compared to treated animals. The van Elteren test found similar results. There was a statistically significant difference in disease stage at end of study between the treatment and control groups regardless of baseline stage of disease (P=0.0184) which was confirmed using a rank ANCOVA model. Table 5 quantifies the difference in rank scores between the treatment groups and the overall mean rank for the treatment and control groups. Overall, cats that received AB070597 had significantly lower stages of CKD over the observation period than cats in the control group (P=0.0307; Table 5). This difference was significant at all-time points except at week 12 (P=0.0955; Table 5 and Figure 6).
Table 3: Odds ratios of IRISa disease stage being lower for treated vs. control cats at each time point
|
Week |
Odds Ratio |
P-value |
|
0 |
0.4872 |
0.0123* |
|
12 |
2.4141 |
0.0407* |
|
24 |
6.8021 |
0.0003* |
|
36 |
5.2169 |
0.0055* |
|
48 |
8.6918 |
0.0003* |
|
60 |
9.1087 |
0.0002* |
|
72 |
10.1981 |
0.0002* |
|
84 |
9.2937 |
0.0012* |
|
96 |
8.2585 |
0.0072* |
|
104 |
19.8020 |
0.0066* |
aInternational Renal Interest Society; *Values marked with superscript are significant (P≤0.05)
Table 4: Mean IRISa disease stage of disease and standard deviation at each time point
|
Group |
Week |
Mean |
Standard Deviation |
|
Control |
0 |
2.40 |
0.621 |
|
12 |
2.60 |
0.675 |
|
|
24 |
2.73 |
0.740 |
|
|
36 |
2.74 |
0.712 |
|
|
48 |
3.04 |
0.824 |
|
|
60 |
2.96 |
0.767 |
|
|
72 |
3.00 |
0.707 |
|
|
84 |
2.95 |
0.686 |
|
|
96 |
3.00 |
0.612 |
|
|
104 |
3.15 |
0.689 |
|
|
Treatment |
0 |
2.90 |
0.772 |
|
12 |
2.62 |
0.728 |
|
|
24 |
2.43 |
0.742 |
|
|
36 |
2.43 |
0.662 |
|
|
48 |
2.59 |
0.607 |
|
|
60 |
2.47 |
0.624 |
|
|
72 |
2.47 |
0.640 |
|
|
84 |
2.47 |
0.640 |
|
|
96 |
2.46 |
0.660 |
|
|
104 |
2.42 |
0.900 |
a International Renal Interest Society
a International Renal Interest Society
a International Renal Interest Society
Body Weight
Over the entire 104 week period, 16 of 27 (59%) treatment-group cats gained weight (median: 0.45 kg, range: 0.1-1.2 kg); 7 (26%) lost weight (median: 0.3 kg, range: 0.2-1.7 kg), including the 5 that died; and 4 (15%) remained unchanged. Two of 32 (6%) control-group cats gained weight (median: 0.65 kg, range: 0.2-1.1 kg), 27 (84%) lost weight (median: 0.6 kg, range: 0.3-3.2 kg), including the 12 that died and 3 (10%) remained unchanged.
Safety
AB070597 was palatable and readily accepted, without exception, by all cats. Although owner diaries were not
Table 5: Parameter estimates from rank ANCOVAa model for IRISb disease stage
|
Parameter/Comparison (t=time) |
Estimate |
Standard Error |
CI |
P-value |
|
Control |
15.9017 |
1.808 |
12.152, 19.651 |
<0.0001* |
|
Treatment |
9.857 |
1.882 |
5.953, 13.760 |
<0.0001* |
|
Overall Difference |
6.045 |
2.617 |
0.617, 11.473 |
0.0307* |
|
Difference (t=12 Weeks) |
5.745 |
3.387 |
-1.041, 12.530 |
0.0955 |
|
Difference (t=24 Weeks) |
10.023 |
3.701 |
2.606, 17.440 |
0.0090* |
|
Difference (t=36 Weeks) |
8.262 |
3.385 |
1.451, 15.072 |
0.0185* |
|
Difference (t=48 Weeks) |
10.098 |
3.320 |
3.397, 16.799 |
0.0041* |
|
Difference (t=60 Weeks) |
9.585 |
2.946 |
3.615, 15.555 |
0.0024* |
|
Difference (t=72 Weeks) |
9.107 |
2.782 |
3.448, 14.776 |
0.0025* |
|
Difference (t=84 Weeks) |
7.663 |
2.986 |
1.581, 13.746 |
0.0152* |
|
Difference (t=96 Weeks) |
6.913 |
2.731 |
1.310, 12.516 |
0.0175* |
|
Difference (t=104 Weeks) |
6.045 |
2.617 |
0.617, 11.473 |
0.0307* |
aAnalysis of covariance; bInternational Renal Interest Society; *Values marked with superscript are significant (P≤0.05)
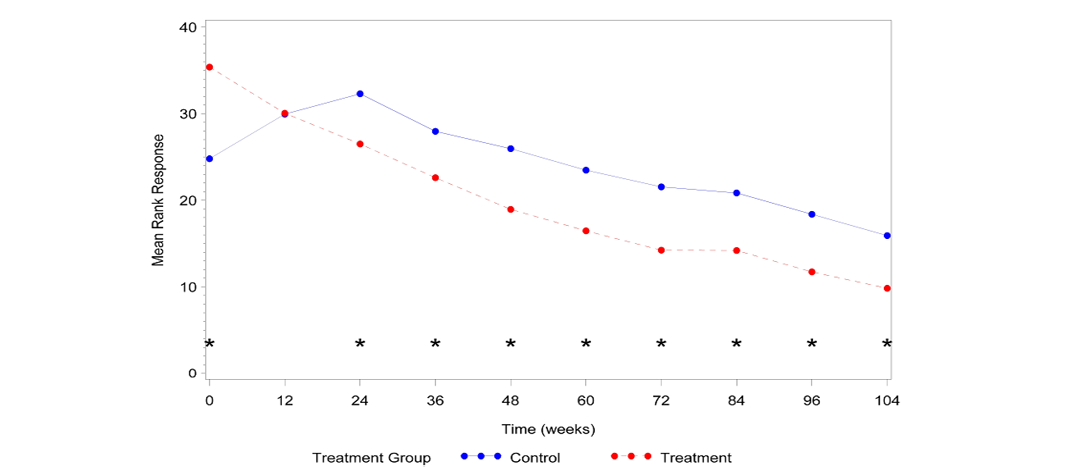
Figure 6:Mean IRISa disease stage vs. Time
aInternational Renal Interest Society; *Significant difference between groups (P≤0.05)
maintained in this study, no reports of gastrointestinal upset or diarrhoea were received. Bi-daily oral 300 mg doses of AB070597 had no adverse effect on serial biochemistry values. (Data not shown)
Discussion
The management of CKD in geriatric cats remains a challenge for veterinary professionals, and exerts a financial burden on their owners. Expanded knowledge and improvements in treatment would benefit all. To the best of the author’s knowledge, this was the first study to investigate the effects of dietary amino acid and peptide supplementation on SCr and disease progression in geriatric cats with CKD. The study used SCr as the principal biochemical marker to quantify the progression of CKD in groups of mainly geriatric cats treated with the supplement formulation AB070597, a mixture of the amino acids L-arginine, glycine, L-glutamine, L-histidine, L-aspartic acid, and L-glutamic acid, as well as the peptide L-carnosine. The amino acids and peptide components of AB070597 were chosen for their specific biochemical effects. L-arginine is the only physiologically significant substrate for the synthesis of nitric oxide. Nitric oxide is an important intra- and trans-cellular signalling molecule involved in the regulation of many physiological and pathophysiological processes in the mammalian organism (Moncada et al., 1991). L-arginine supplementation protects renal tissue from the negative effects of renal ischemia, from renal hypertrophy, and reduces the concentration of orotic acid in the urine of rats fed high protein diets (Reyes et al., 1994). Glycine dietary supplementation reduces renal ischemia-reperfusion tubular injury in rats and improves GFR over non-treated rats (Yin et al., 2002). Glycine protects mammalian renal cells against ischemic injury by reducing cellular membrane permeability (Pan et al., 2005). It is generally accepted that glycine depletion predisposes isolated proximal tubules to cell damage. Oral glycine supplementation in the rat model provides protection against renal cell damage and dysfunction (Nissim and Weinbert, 1996). L-glutamine acts as a regulator of protein, glycogen, and free fatty acid metabolism and regulates gluconeogenesis (Perriello et al., 1997). The liver is not the exclusive site for glucose synthesis in humans. Twenty-five percent of systemic glucose production takes place in the kidney and is stimulated by the renal gluconeogenic precursors, L-glutamine, lactate, and glycerol (Stumvoll, 1998; Stumvoll et al., 1998). This amino acid regulates carbohydrate metabolism, suppresses proteolysis in chick skeletal muscles, and stimulates protein synthesis, thereby counteracting the muscle-wasting (Wu and Thompson, 1990). Under conditions of illness, metabolic requirements exceed muscle deposits (the primary site of synthesis and storage; Balzola and Boggio-Bertinet, 1996). Exogenous supplementation is important in critically ill patients with kidney failure (Wernerman, 2008). L-histidine is an essential amino acid for normal humans and for those with CKD. Dietary deficiency results in greatly diminished erythropoiesis (Kopple and Swendseid, 1975). Low serum concentrations of histidine are associated with protein wasting, inflammation, oxidative stress, and greater mortality in human CKD patients. Oral supplementation may prevent or suppress complications in CKD by reducing these factors and by improving nitrogen metabolism (Watanabe et al., 2008). L-glutamic acid and L-aspartic acid act as efficient reactive-oxygen species scavengers and thereby protect the kidneys from ongoing damage caused by these radicals (Yatzidis, 2002). Oral supplementation of L-aspartic acid lowers serum creatinine and BUN levels in male and female Fischer 344 rats (Tada et al., 2008). L-carnosine increases the production of BMP-7 in human periodontal ligament cells (Ito-Kato et al., 2004). BMP-7 induces the mesenchymal-to-epithelial transition in renal fibroblasts and facilitates regeneration of injured kidney (Zeisberg et al., 2003; Xu et al., 2009). These amino acids are included in the formulation of AB070597 because of their importance in kidney health.
SCr was chosen as the primary measure of renal function for practical reasons. Without a practical non-invasive method for measuring GFR in cats, plasma SCr remains the most useful biochemical parameter to measure renal performance, and it is strongly correlated with disease stage (Elliott and Barber, 1998). The predictability of progression rates, as reflected by increased SCr in human patients, has been reported more frequently than any other measure (Perrone et al., 1992). Reproducibility is also important. The average intra-individual coefficient of variation of SCr in human patients with renal disease was only 5.3% as reported by Hölzel (1987). In a prior literature review, this parameter was determined to be the most reliable of the methods used to follow changes in renal function at low GFR (Brochner-Mortensen, 1978). Chronic kidney disease is progressive and results in a significant increase in SCr as the disease advances through IRIS stages 2, 3, and 4 (Boyd et al., 2008; Elliott and Barber, 1998; Syme et al., 2006).
Conversely, the use of SCr for measuring renal function has disadvantages. Urinary excretion of creatinine decreases as CKD progresses due to increased metabolic degradation of creatinine (Mitch et al., 1980). Measurements can also be affected by increased or decreased protein consumption (Heymsfield et al., 1983; Wolthuis, 1961). Small decreases in SCr might be anticipated in subjects undergoing standard treatment, which often includes the use of protein-restricted diets, but no animals in the current study were on such diets. Concentrations of SCr also decline with decreasing muscle mass and are associated with weight loss, which is a common sequela of CKD (Heymsfield et al., 1983). If overall muscle mass were reduced in the animals treated in this study, it would be expected that median SCr would have been affected. However, 59% of cats receiving AB070597 gained weight (median: 0.45 kg, range, 0.1-1.2 kg) and 15% maintained their original weight (total 74%), which suggests that there was little to no effect on SCr due to reduced muscle mass in the study population. Measurements to determine the ratio of the change in lean muscle mass to body fat were not performed in this pilot study for either the treatment or control subjects. There are numerous methods for analysing the body composition of cats and dogs, including chemical analysis, densitometry, total body water, absorptiometry, ultrasonography, and electrical impedance. None of these fit well into the clinical environment. A widely adopted clinical approach uses the combination of body weight, and morphometry (including body condition score, body mass index and tape measurements), but the technique is time consuming, and requires training of technical personnel. In addition, many tests for body composition are precise but not accurate, whereas some lack both precision and accuracy (German, 2005). Coupled with the uncertainty of the nature of the weight change in the study subjects and lack of accuracy and precision with most of the available clinical methods for determining muscle mass and fat mass ratios, the author chose simple body weight change as the preferred measurement parameter.
Cats have evolved on a diet comprised mainly of animal tissue and are regarded as strict carnivores with unique high protein nutritional requirements. This evolution has resulted in the essentiality of certain nutrients (vitamin D, niacin, taurine, and arginine) for the cat that are non-essential for omnivores (Green et al, 2008). The higher protein requirement of the cat results from an increased requirement for dispensable nitrogen, rather than for an increased requirement for essential amino acids (Rogers and Morris, 1979). Dietary protein restriction is recommended when cats reach late IRIS stage 3 or IRIS stage 4 (Renal Dysfunction in Small Animals, 2015).
In the current study, cats treated with AB070597 experienced a significant reduction in median SCr for the overall study period and at each intervening time period, except week 84, as well as a significant reduction in mean IRIS disease stage at all-time points. In comparison, a study by Elliott et al. (2003) of acid-base balance in 55 cats with CKD, that received standard care, found that renal function significantly decreased in 21 cats over the course of their 67-week study, as evidenced by significant increases in SCr and decreases in body weight. Of the 34 remaining cats, only 18 were stable and alive by study’s end.
In another study by Boyd et al. (2008) that investigated the survival of cats with naturally occurring CKD, 211 cats with a mean age of 12.8±4.4 years were divided, at the time of diagnosis, into a modified IRIS stage 2, and unmodified stages 3 and 4. Mean SCr and IRIS disease stage increased in all three groups over their study.
Cats with CKD that received AB070597 as a dietary supplement did not experience serial increases in median SCr, nor did they advance to higher median IRIS disease stages. Cats receiving AB070597 had stable or reduced SCr values for up to 104 weeks, and there was an overall improvement in IRIS disease stage. These results suggest that some, or possibly all, of the amino acids and peptide in AB070597 may attenuate SCr increases and disease progression in geriatric domestic cats with CKD.
Studies of the individual component effects on SCr and disease stage would be appropriate. Additional randomized studies with more subjects and longer follow-up times are warranted, and future studies of AB070597 and its effects on renal function in geriatric cats, employing a much larger population, are planned.
Acknowledgments
The author is grateful for the generous financial support of Mary Nardone and Joyce Kennedy, without whom this study would not have been possible. The author thanks the manuscript experts at Whitsell Innovations, Inc. and American Journal Experts for their editorial reviews, suggestions and for assistance in preparation and formatting, as well as the mathematically capable staff at PharPoint, Inc. for assistance in data analysis and figure preparation.
Conflict of Interest
Author declares no conflict of interests.
References


