Research Journal for Veterinary Practitioners
Research Article
Res. j. vet. pract. 3 (3): 58 - 68
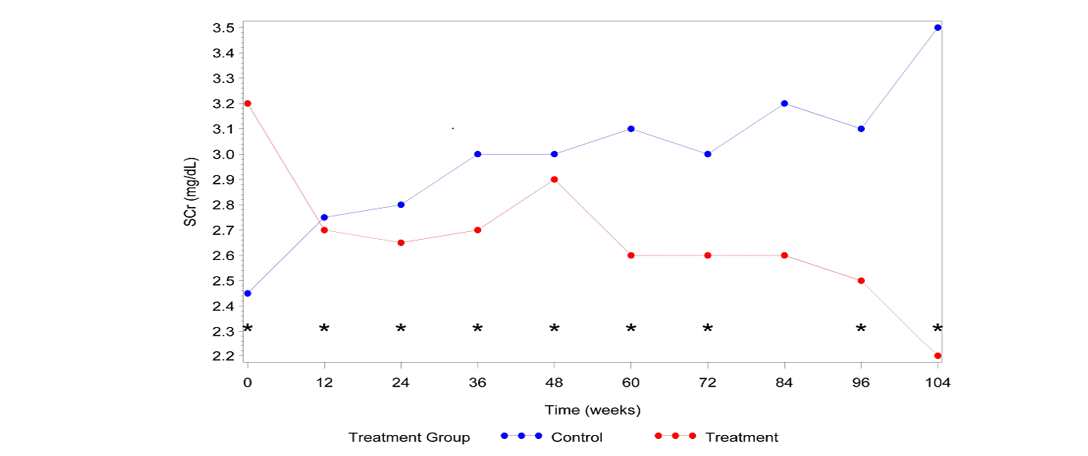
Figure 1
Median SCra vs. Time
a SCr=serum creatinine; * Significant difference between groups (P≤0.05)
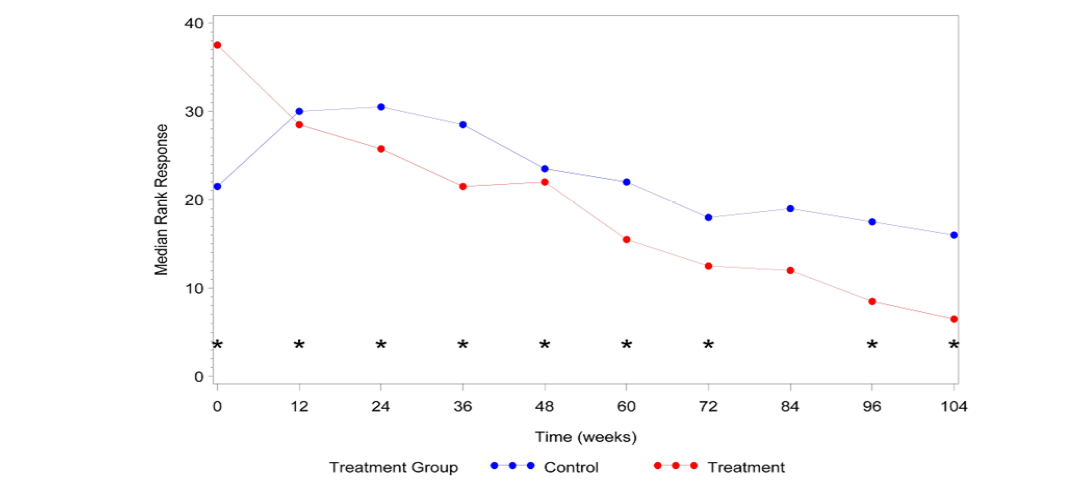
Figure 2
Median SCra rank vs. Time
aSCr=serum creatinine; *Significant difference between groups (P≤0.05)
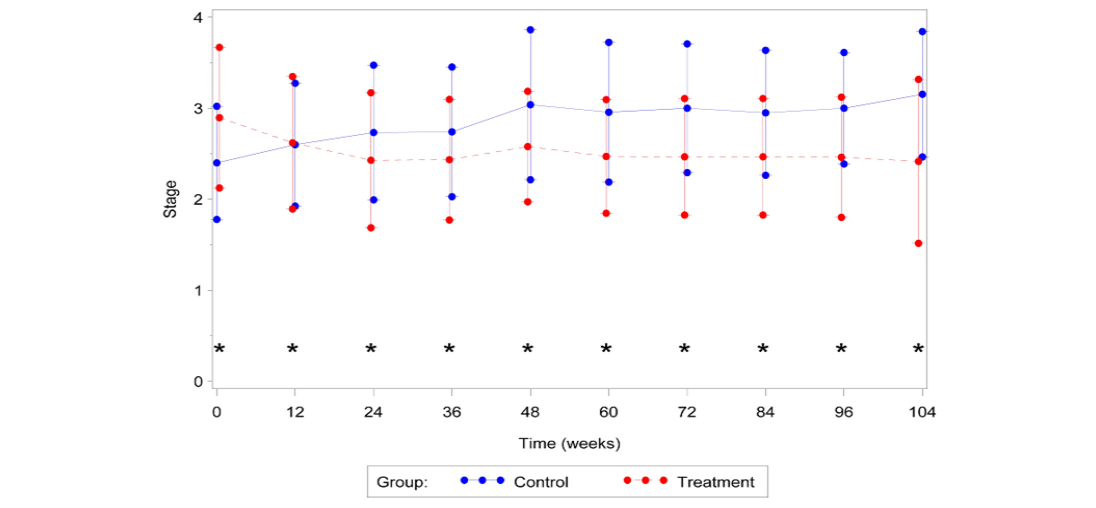
Figure 3
Mean IRISa disease stage +/- Standard Deviation vs. Time
aInternational Renal Interest Society; *Significant difference between groups (P≤0.05)
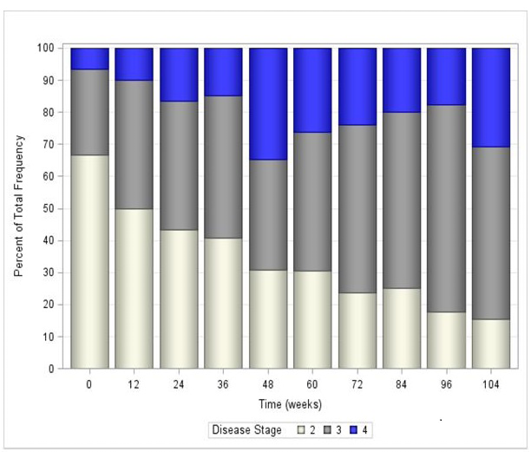
Figure 4
Cumulative IRISa disease stage frequencies in control group vs. Time
a International Renal Interest Society
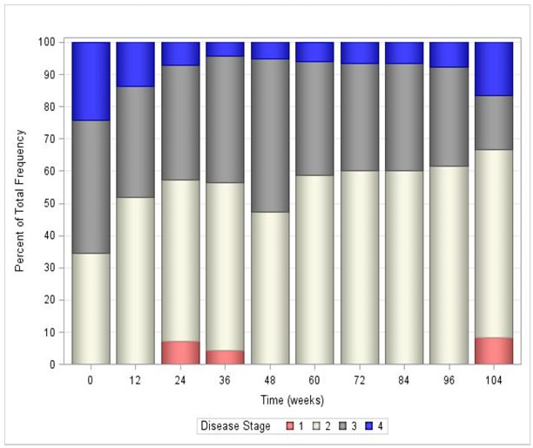
Figure 5
Cumulative IRISa disease stage frequencies in treatment group vs. Time
a International Renal Interest Society
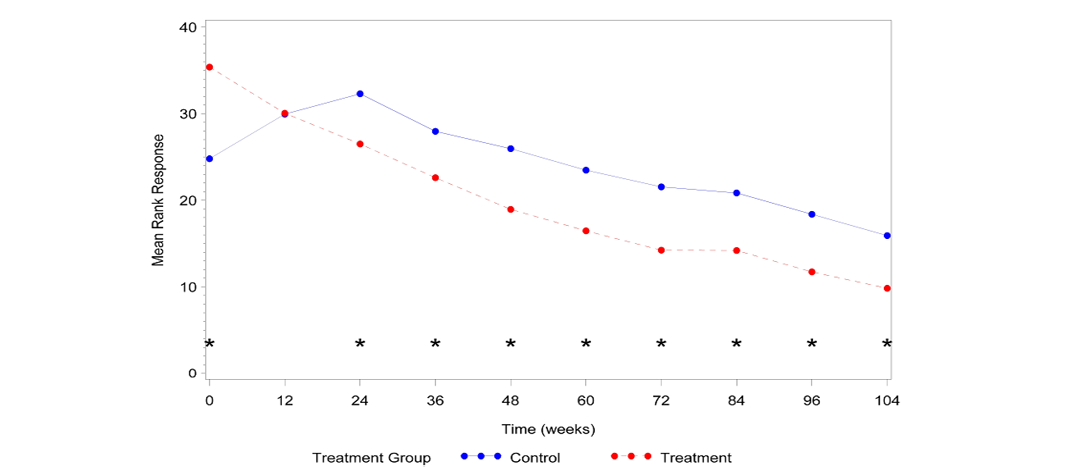
Figure 6
Mean IRISa disease stage vs. Time
aInternational Renal Interest Society; *Significant difference between groups (P≤0.05)


